Your complete guide to monitoring system performance, running network diagnostics, and getting AI-powered insights - all on your iPhone.
📊
Real-Time Metrics
CPU, memory, battery & more
🧠
AI Insights
On-device intelligence
🌐
Network Tools
16 pro diagnostic tools
🛠️
System Tools
Hardware, PDF, image & dev
🔔
Smart Alerts
Background monitoring 24/7
Dashboard
Your at-a-glance overview of everything happening on your device.
The Dashboard is the central hub of StatBoard. It shows real-time metric cards for CPU, Memory, Battery, Storage, Network, and Uptime. Each card displays the current value, a status indicator (Normal, Warning, or Critical), and a mini sparkline chart for trends.
Dashboard
Real-time overview of all system metrics
1
View system status
The System Status banner at the top summarizes overall health. Tap the Intelligence button to open the AI-powered System Health screen.
2
Tap any metric card
Tap a metric card (CPU, Memory, Battery, Storage, or Network) to open its detail view with historical charts, breakdowns, and detailed stats.
3
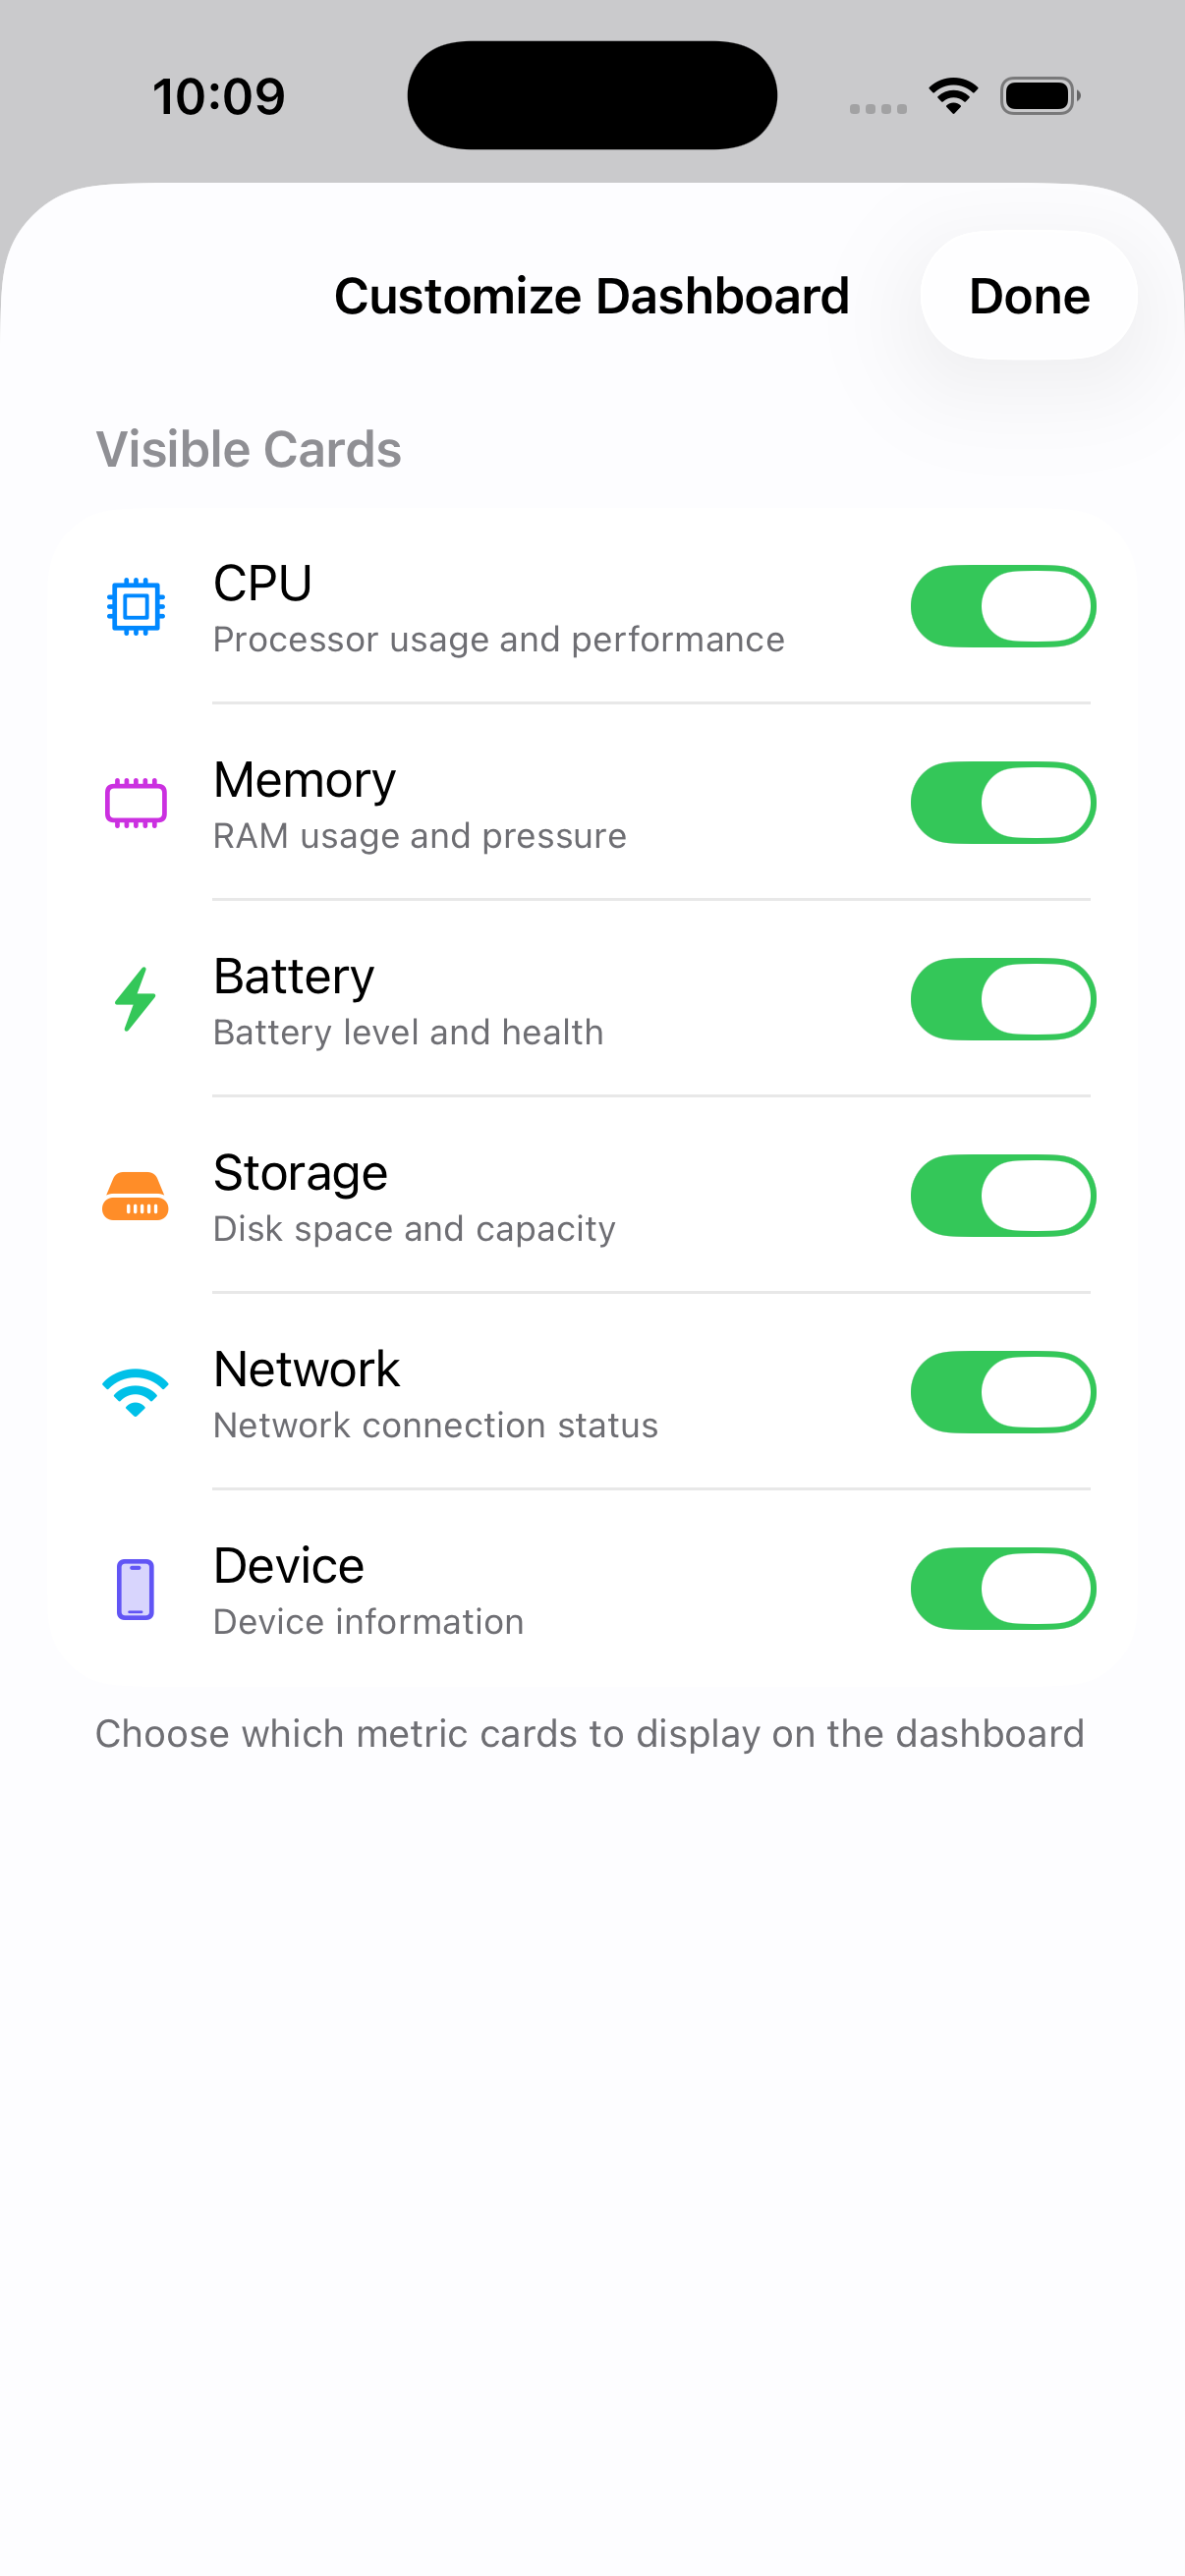
Customize visible cards
Open Settings > Appearance and use the Dashboard Cards toggles to show or hide individual metric cards. Choose which metrics matter most to you.
Dashboard Cards
Toggle metric cards in Settings > Appearance
System Health & AI Insights
AI-powered analysis that explains what your metrics mean in plain language.
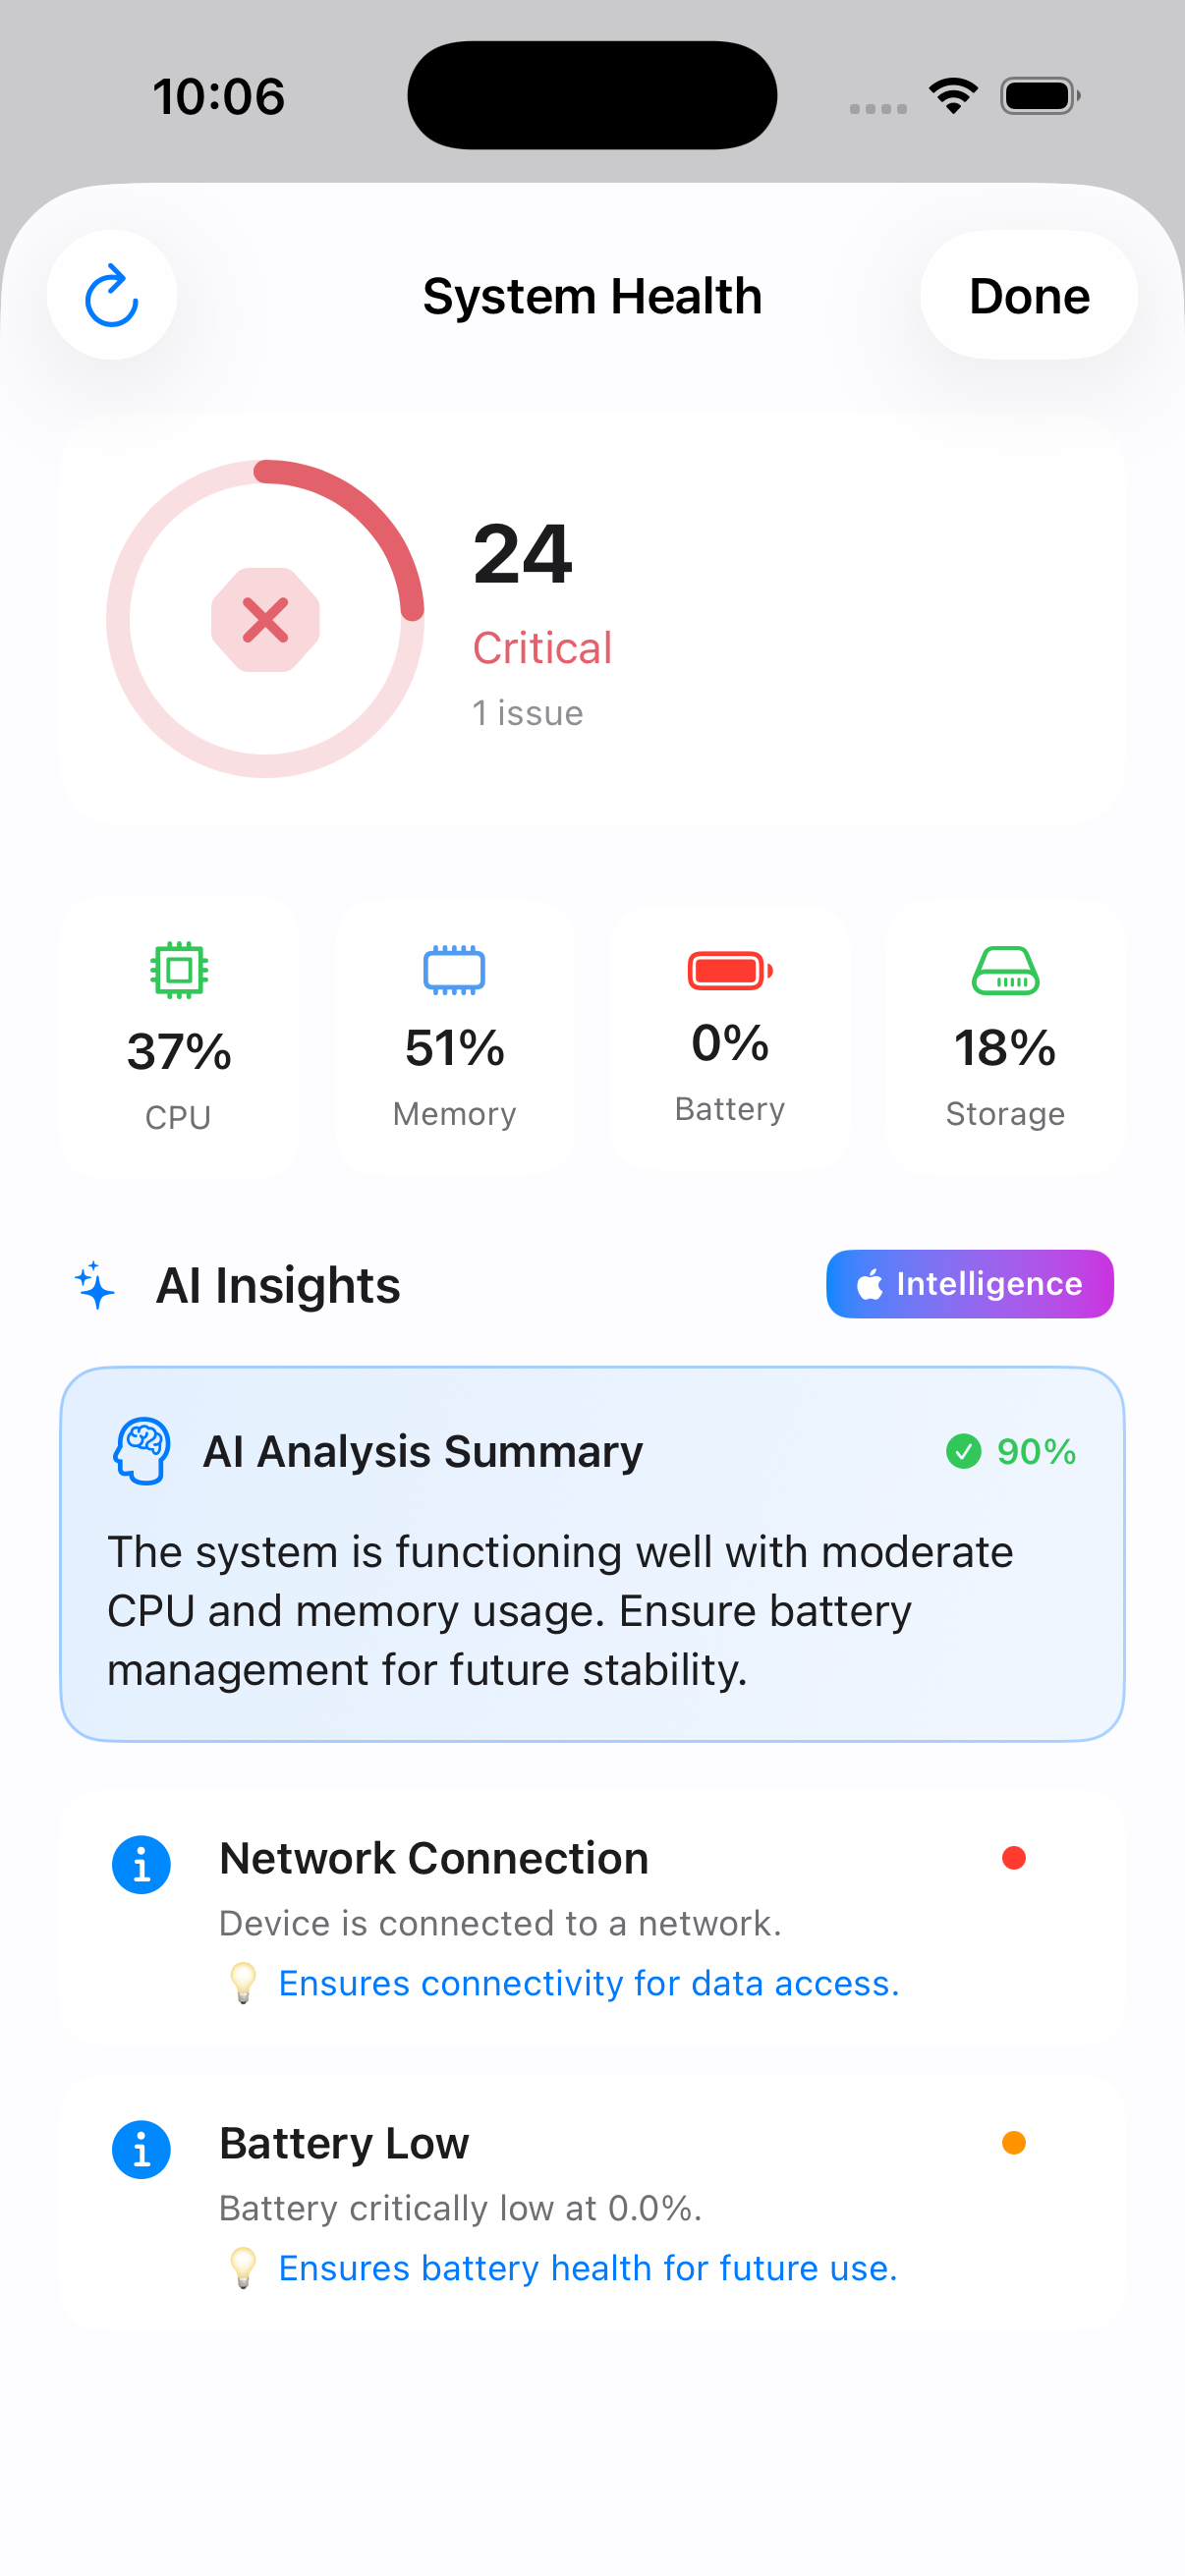
The System Health screen provides a comprehensive score (0–100) based on your device's current CPU, memory, battery, and storage status. The AI Analysis Summary uses on-device intelligence to generate actionable recommendations.
System Health
AI-generated insights with overall health score
🎯
Health Score
A single number (0–100) representing your device's overall system health, with color-coded severity levels.
🧠
AI Summary
Natural language explanation of what's happening on your device, powered by Apple's on-device Foundation Models.
💡
Recommendations
Specific, actionable suggestions to improve performance, battery life, or storage usage.
🔍
Issue Detection
Automatic detection and flagging of anomalies like high CPU usage, memory pressure, or low battery.
CPU Monitoring
Track processor usage in real time with per-core breakdowns and historical trends.
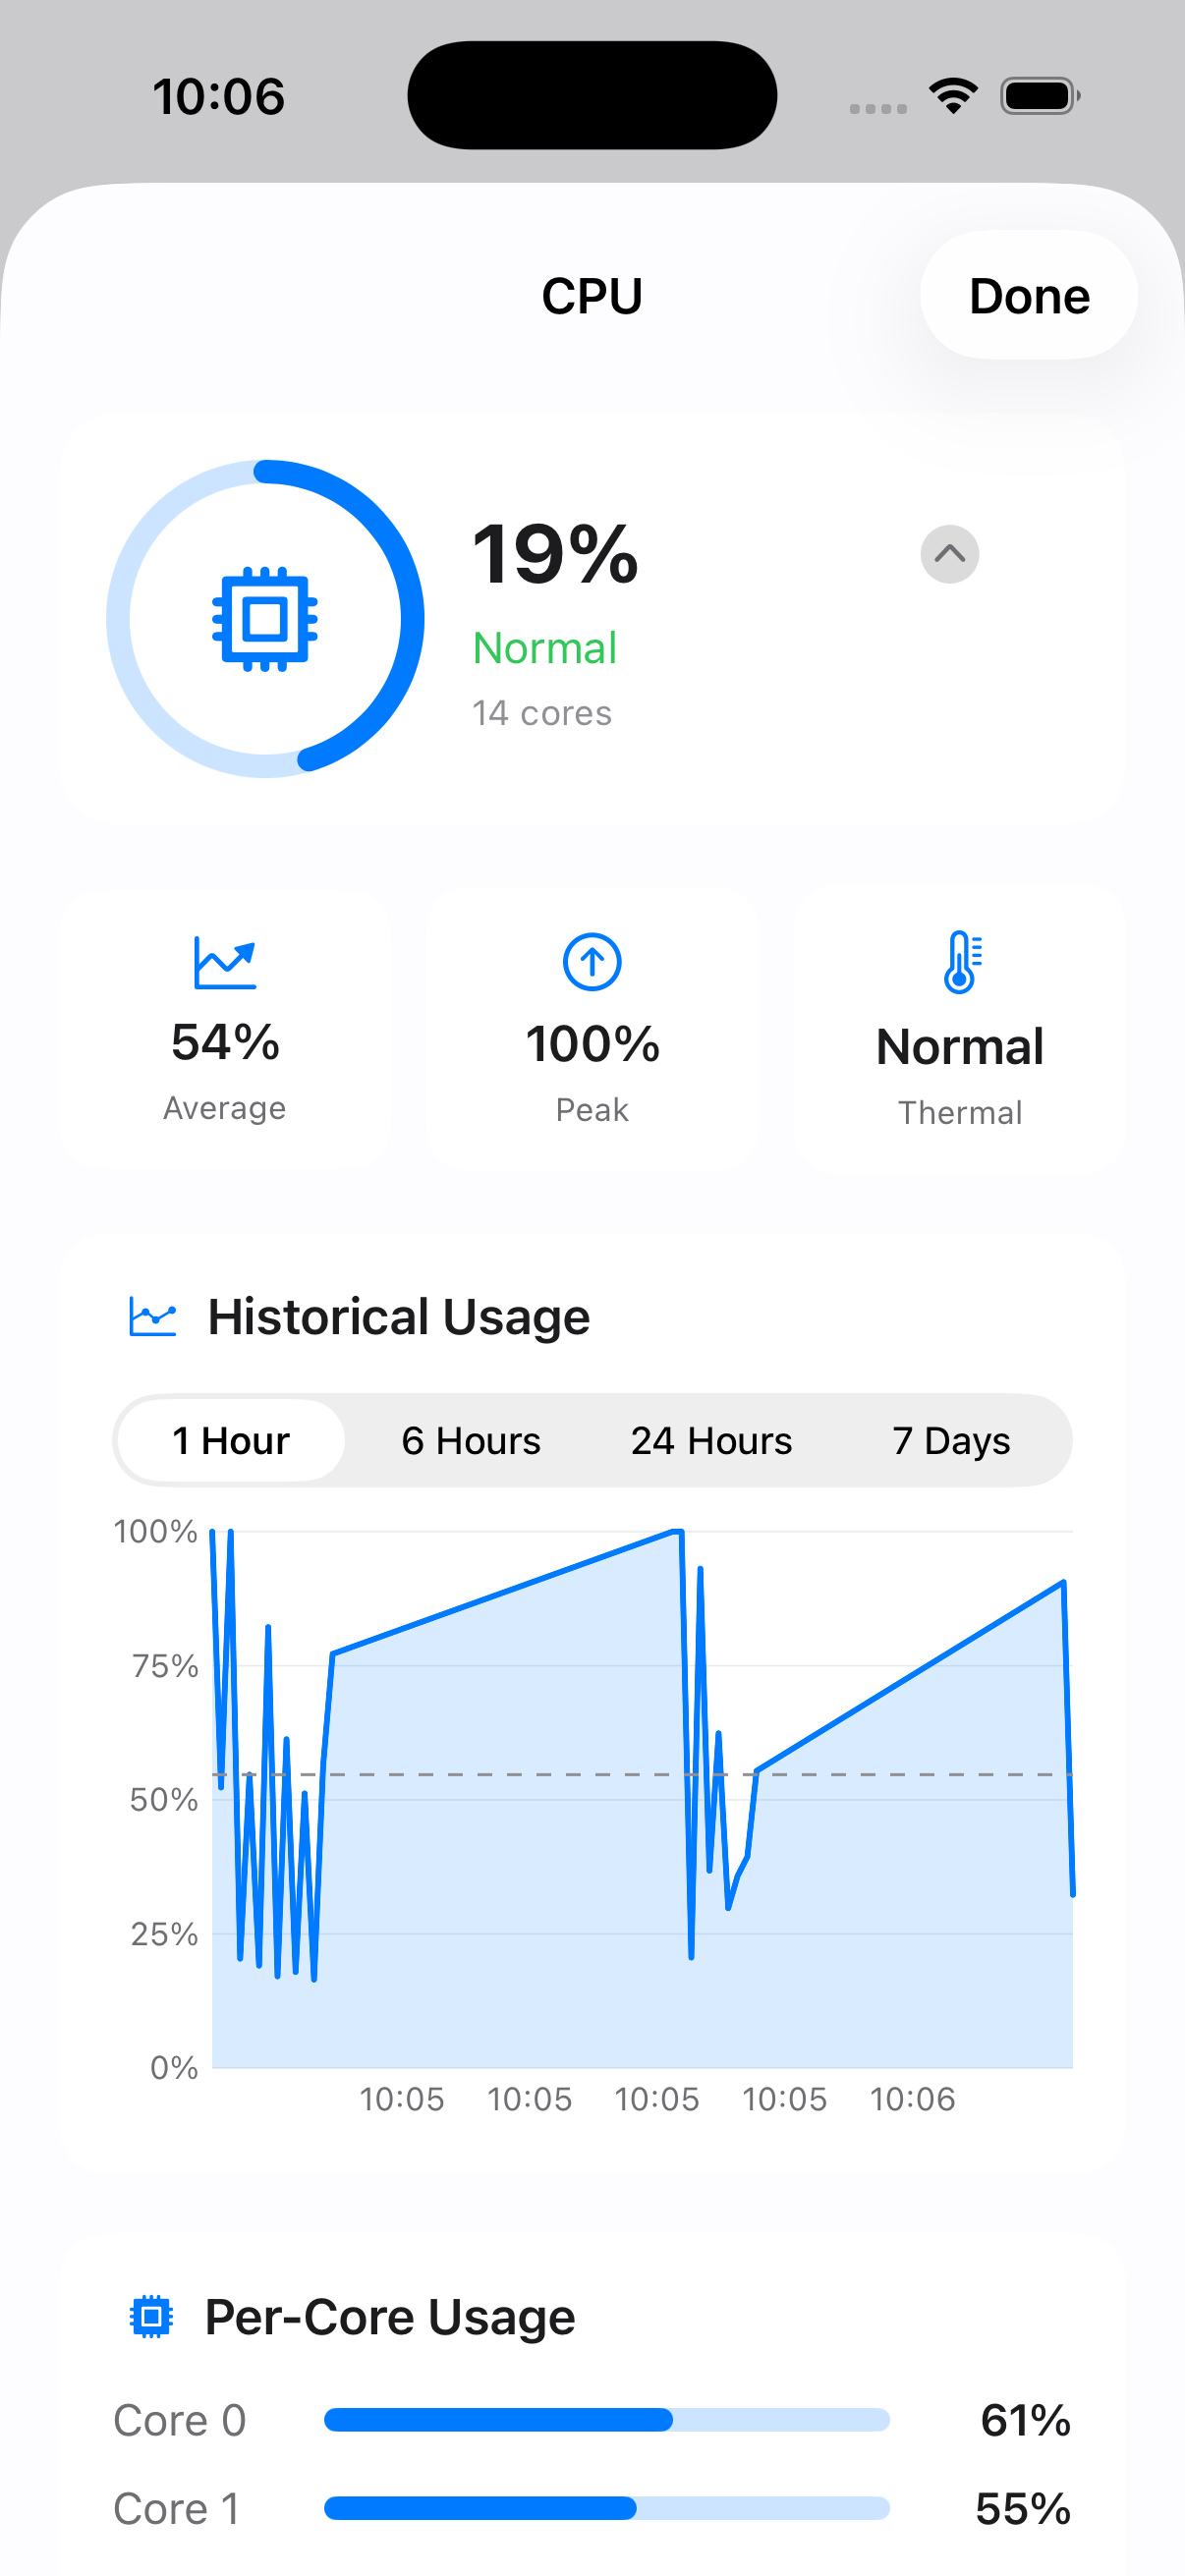
The CPU detail view shows your current overall CPU usage as a percentage with a ring chart, plus quick stats for User, System, and Idle time. E-core and P-core load, load averages, thermal state, historical charts, and per-core breakdowns are included on supported devices.
CPU Detail
Real-time usage with historical chart and per-core stats
📈
Historical Usage
View CPU usage over 1 hour, 6 hours, 24 hours, or 7 days. An average line helps identify sustained load.
🧩
Per-Core Usage
Individual usage bars for every CPU core on your device, showing how load is distributed across performance and efficiency cores.
🌡️
Thermal State
Real-time thermal monitoring: Normal, Fair, Serious, or Critical. Know when your device is throttling.
Memory Monitoring
Understand how your iPhone's RAM is being used with detailed breakdowns.
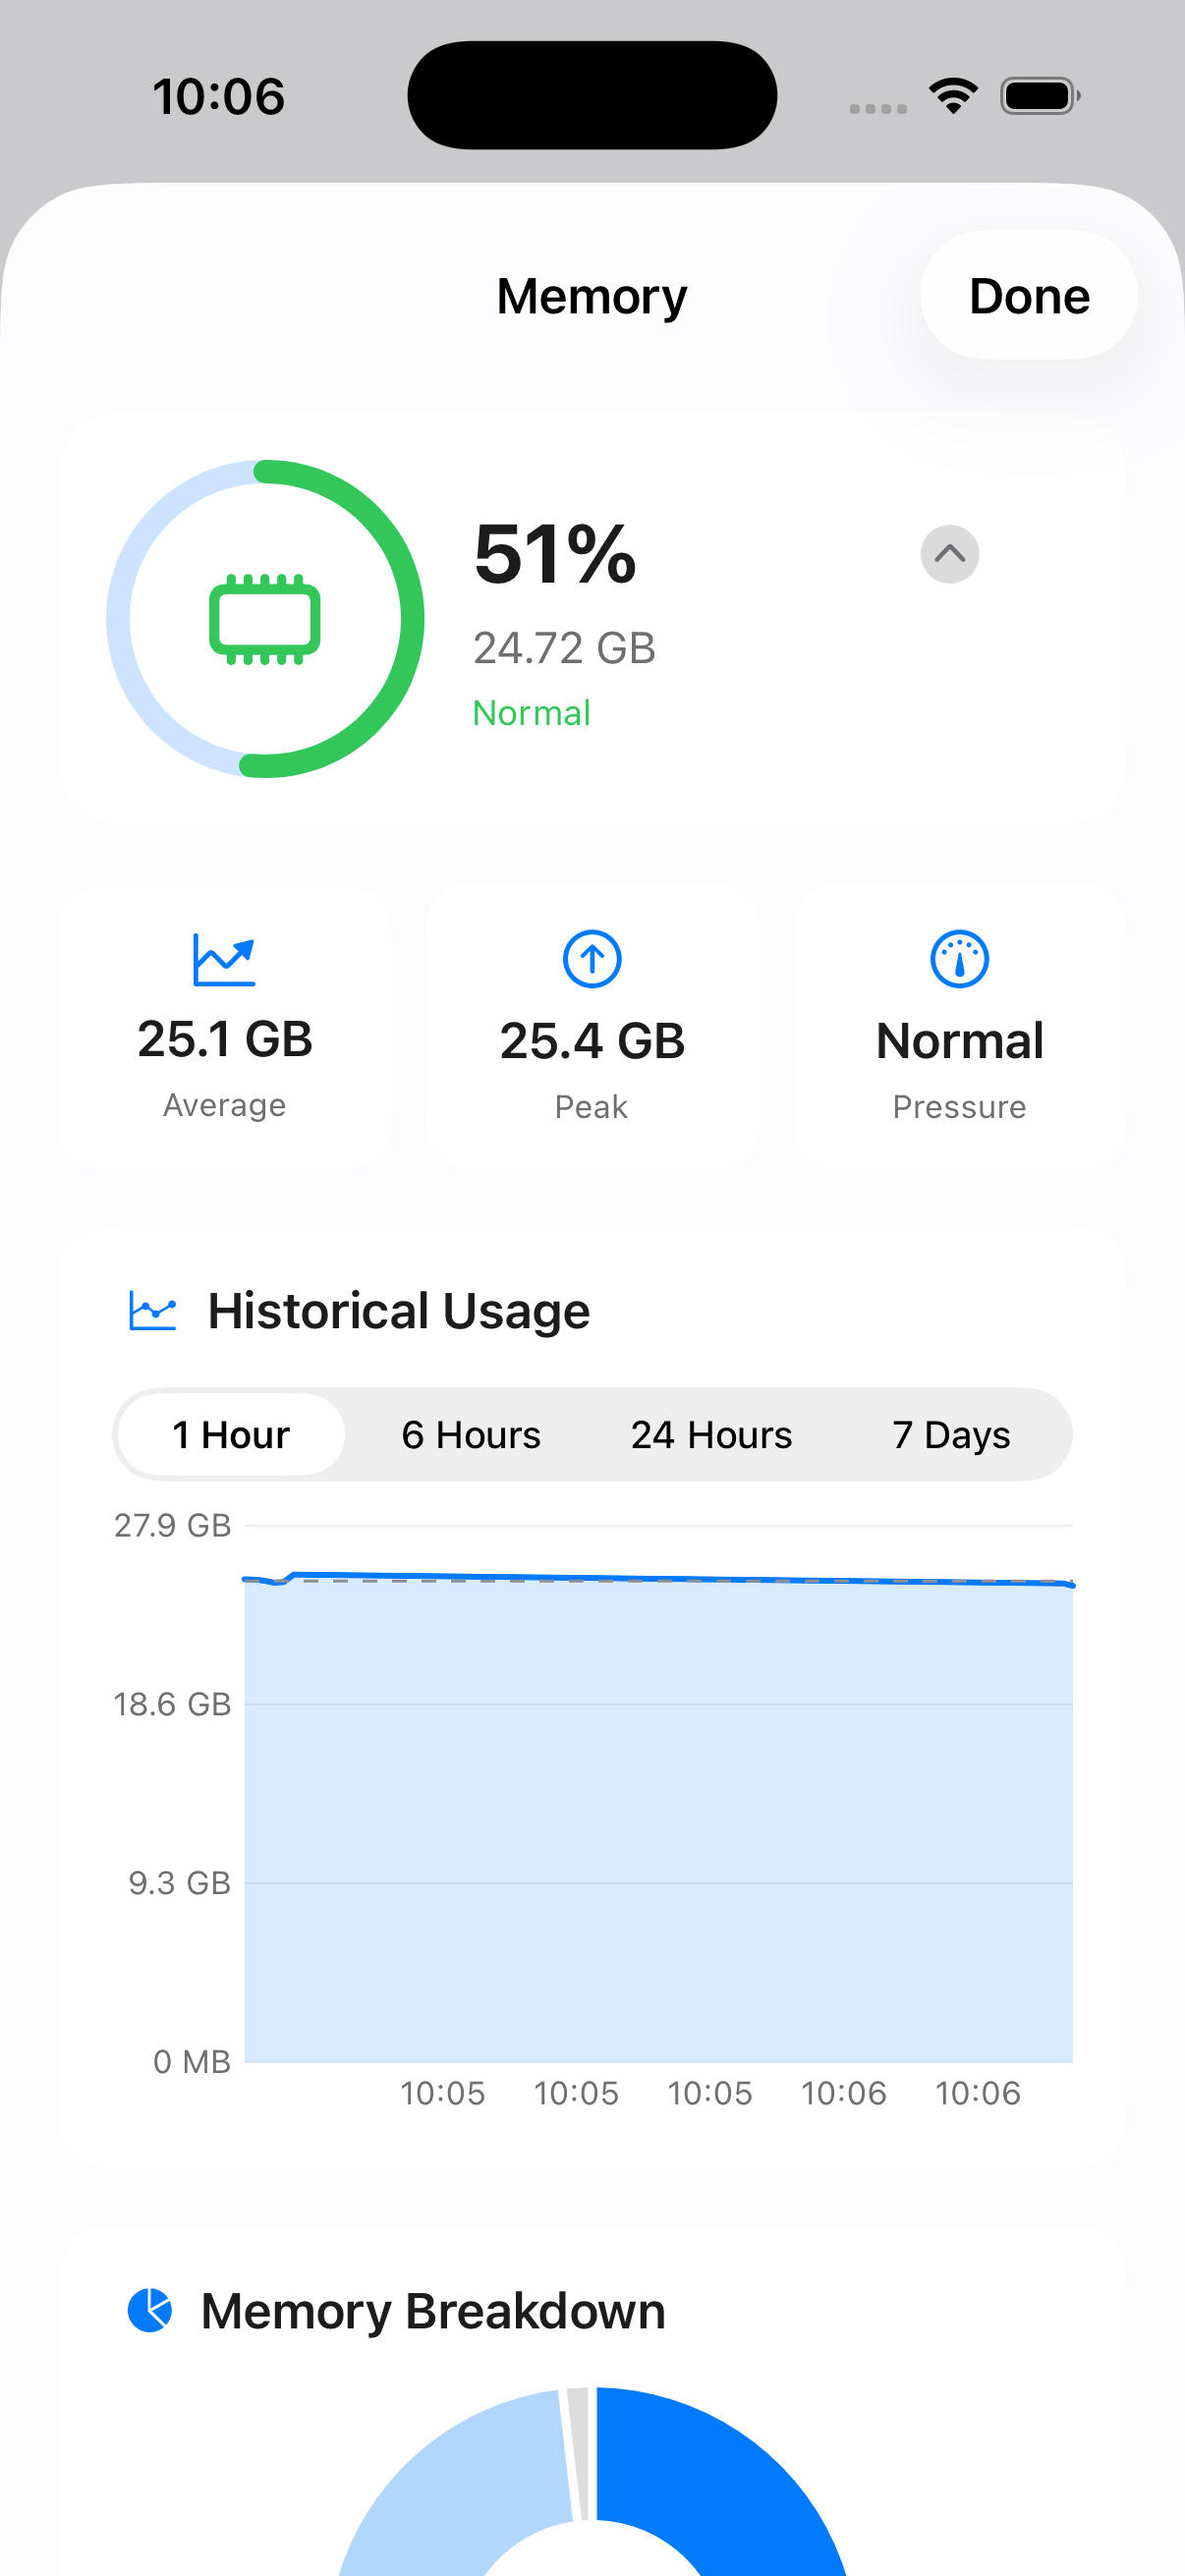
The Memory detail view displays current usage in both percentage and absolute values (GB). Quick stats show Average usage, Peak usage, and current memory Pressure level (Normal, Warning, Critical).
Memory Detail
Usage trends with active, wired, compressed, and free breakdown
📊
Memory Breakdown
A pie chart showing Active, Wired, Compressed, Inactive, and Free memory. Understand exactly where your RAM is going.
⚠️
Pressure Monitoring
Real-time memory pressure level helps you know when apps might be terminated due to low memory.
Battery Monitoring
Track your battery's charge level, health, and performance over time.
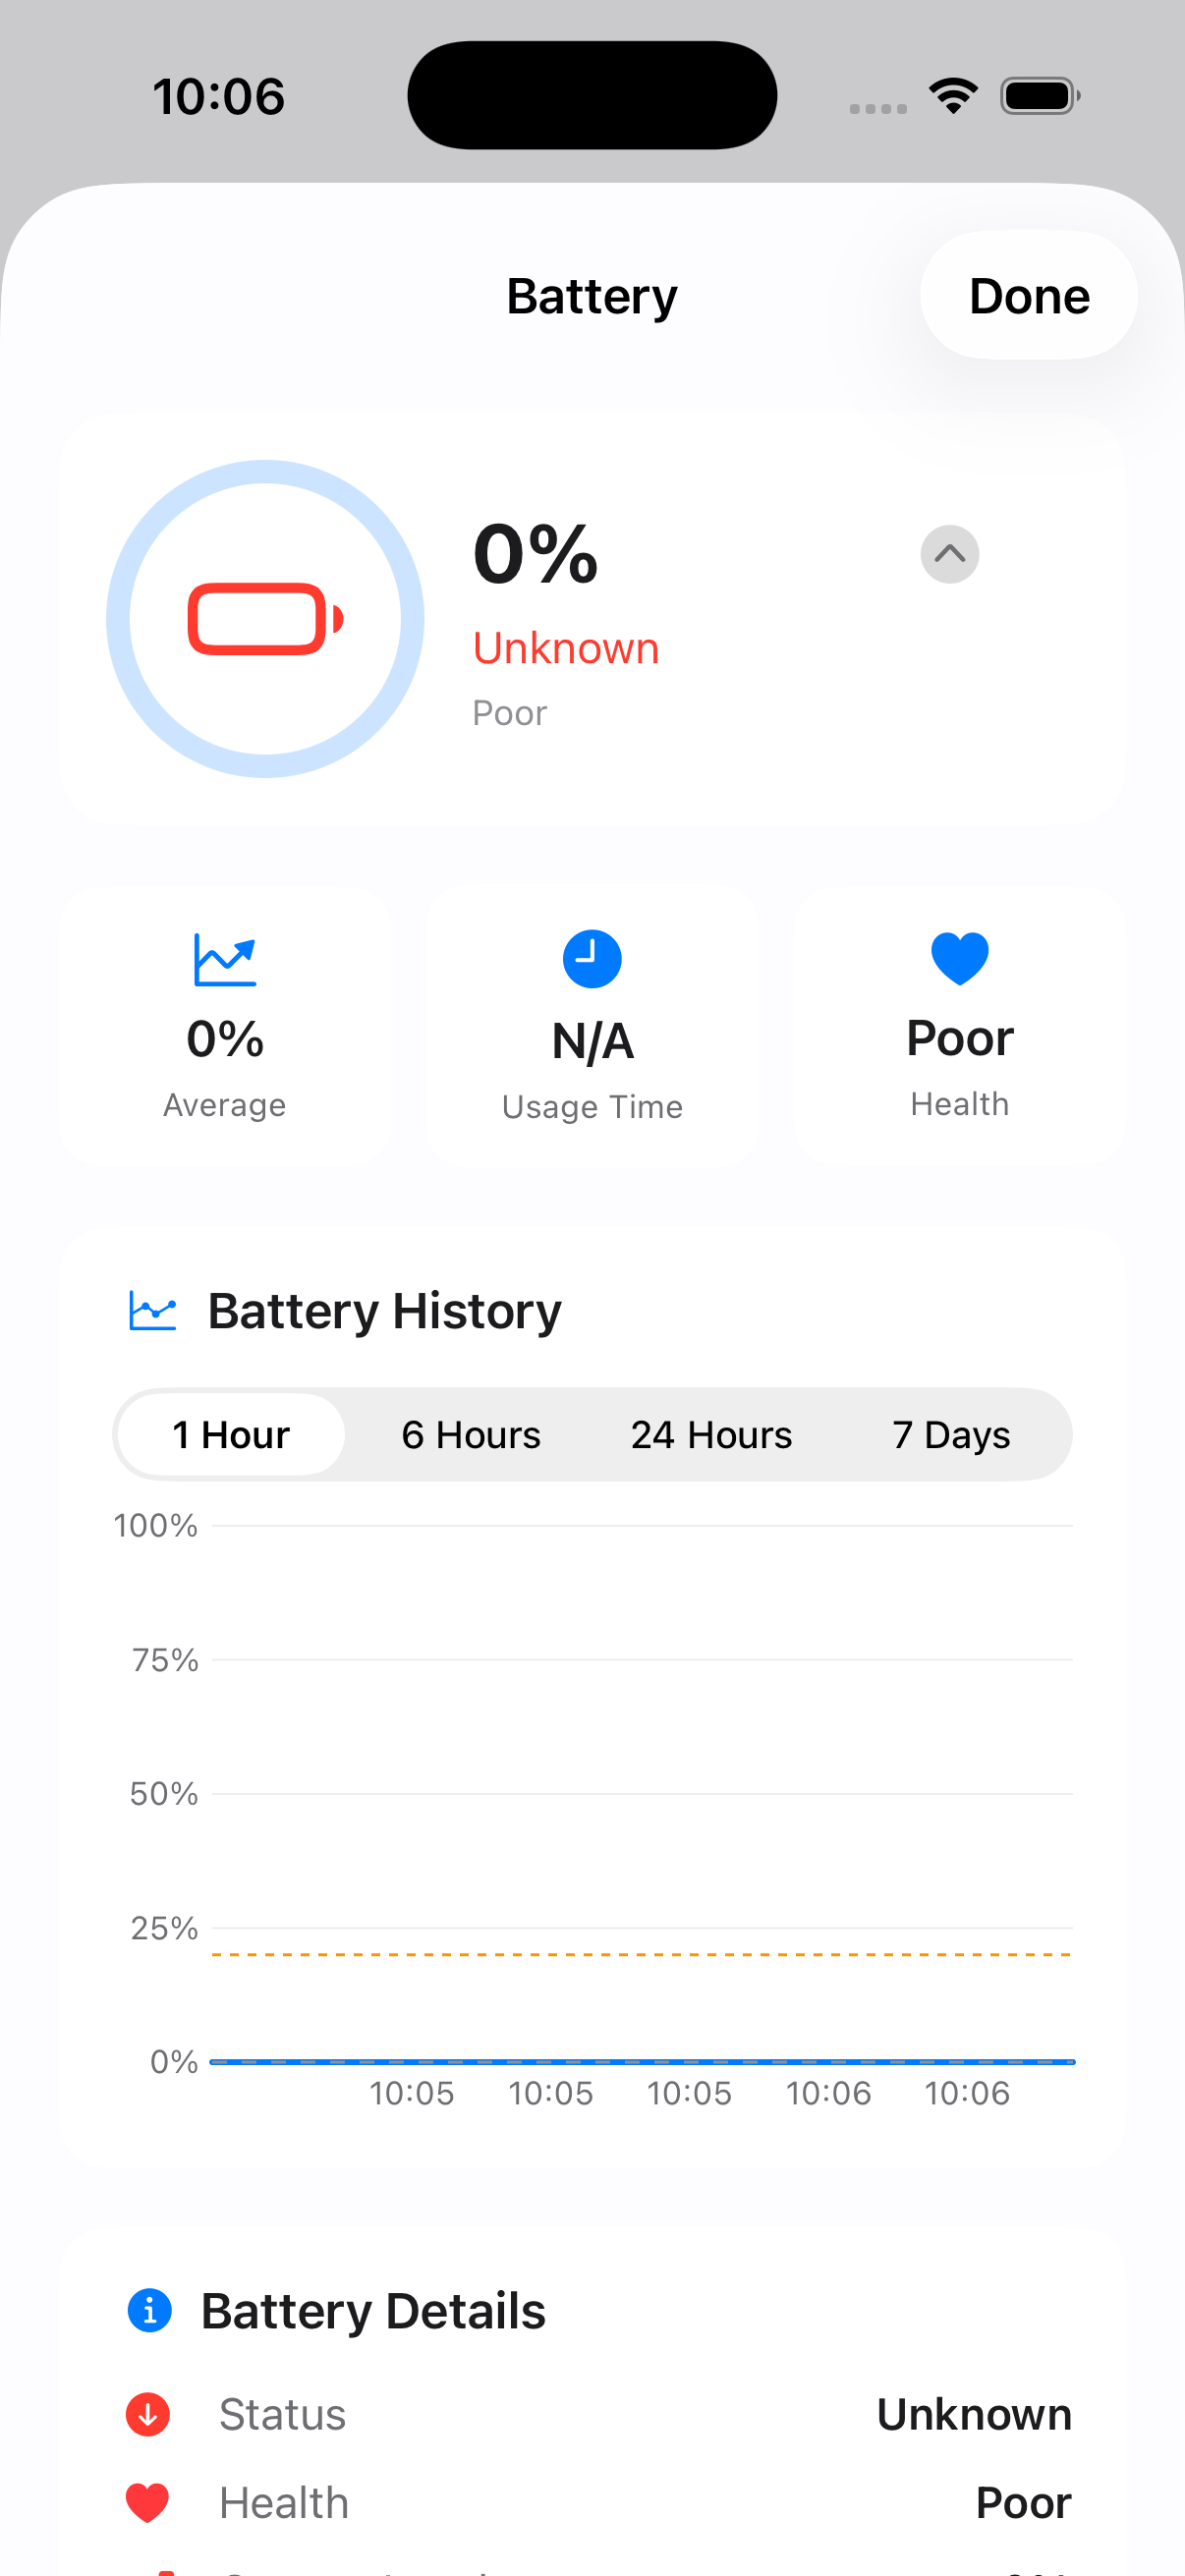
The Battery detail view shows the current charge level, charging status, and battery health rating. Quick stats include Average level, estimated Usage Time, and Health condition. A historical chart tracks battery level over time.
Battery Detail
Charge history, health status, and battery details
📉
Battery History
Track charge and discharge patterns over 1 hour to 7 days. The dashed average line shows typical battery behavior.
❤️
Battery Health
View your battery's overall health rating and detailed information including charging status and capacity.
Storage Analysis
See exactly how your device's storage is being used and find opportunities to free space.
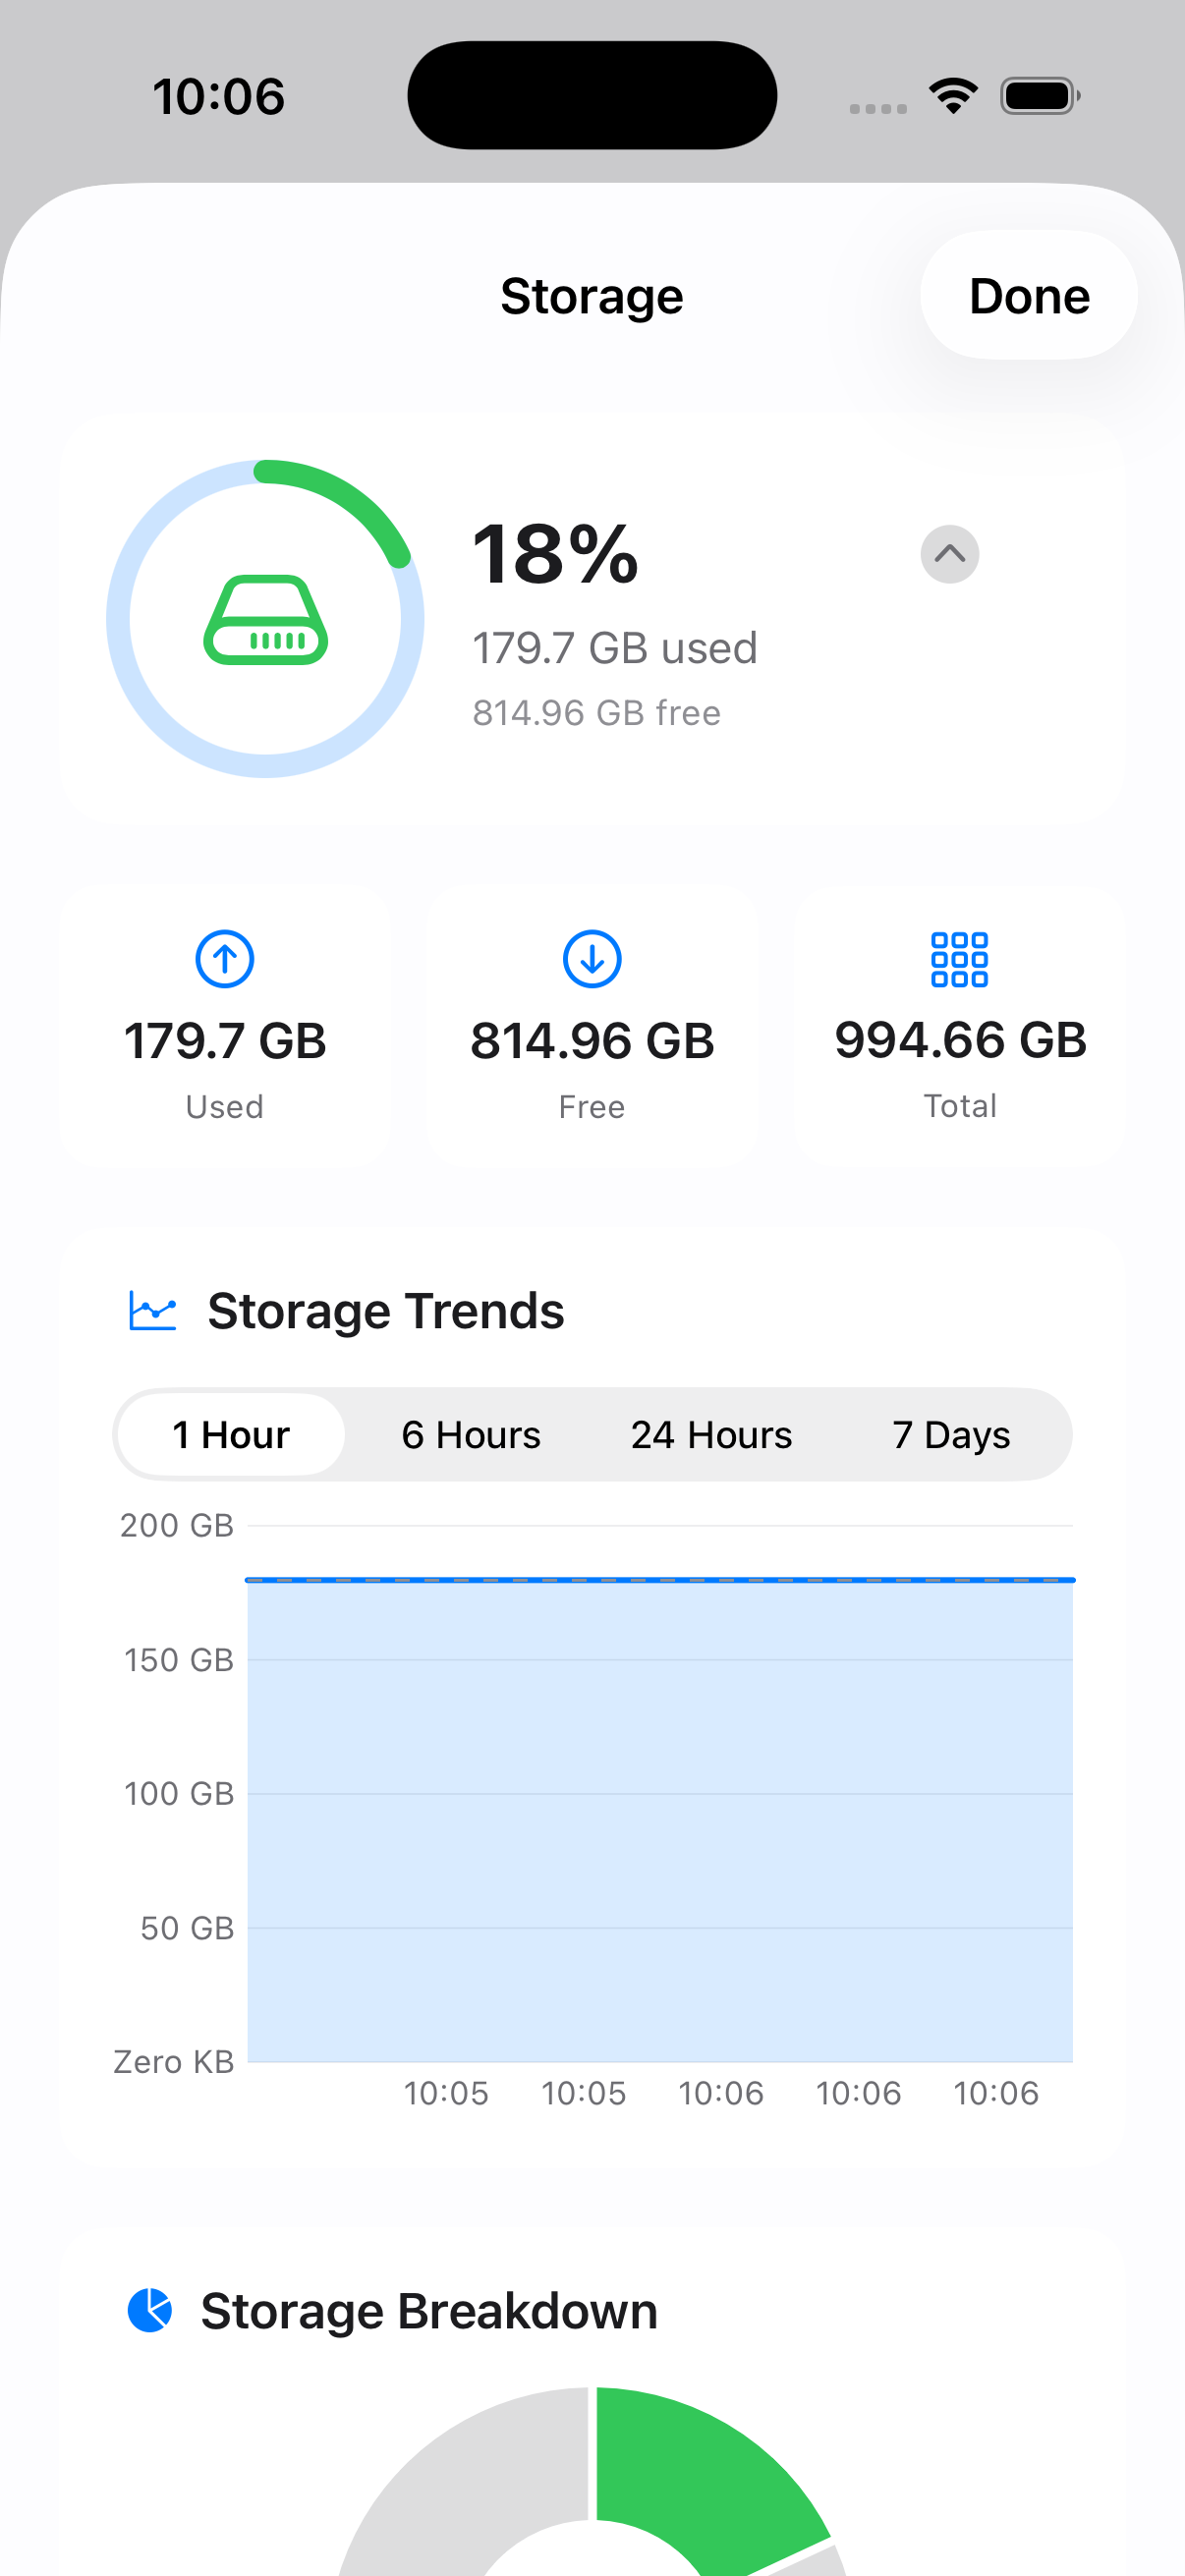
The Storage detail view shows the percentage of storage used, with both used and free space in absolute values. Quick stats display Used, Free, and Total capacity. Scroll down for storage trends, a category breakdown, and partition details.
Storage Detail
Usage trends with category breakdown and partition info
📂
Storage Breakdown
A pie chart showing how storage is distributed across Apps, Media, System, and other categories.
💽
Partition Details
View individual storage partitions with their usage percentage, capacity, and file system type.
Network Monitoring
Monitor your connection quality, latency, and all network interfaces.
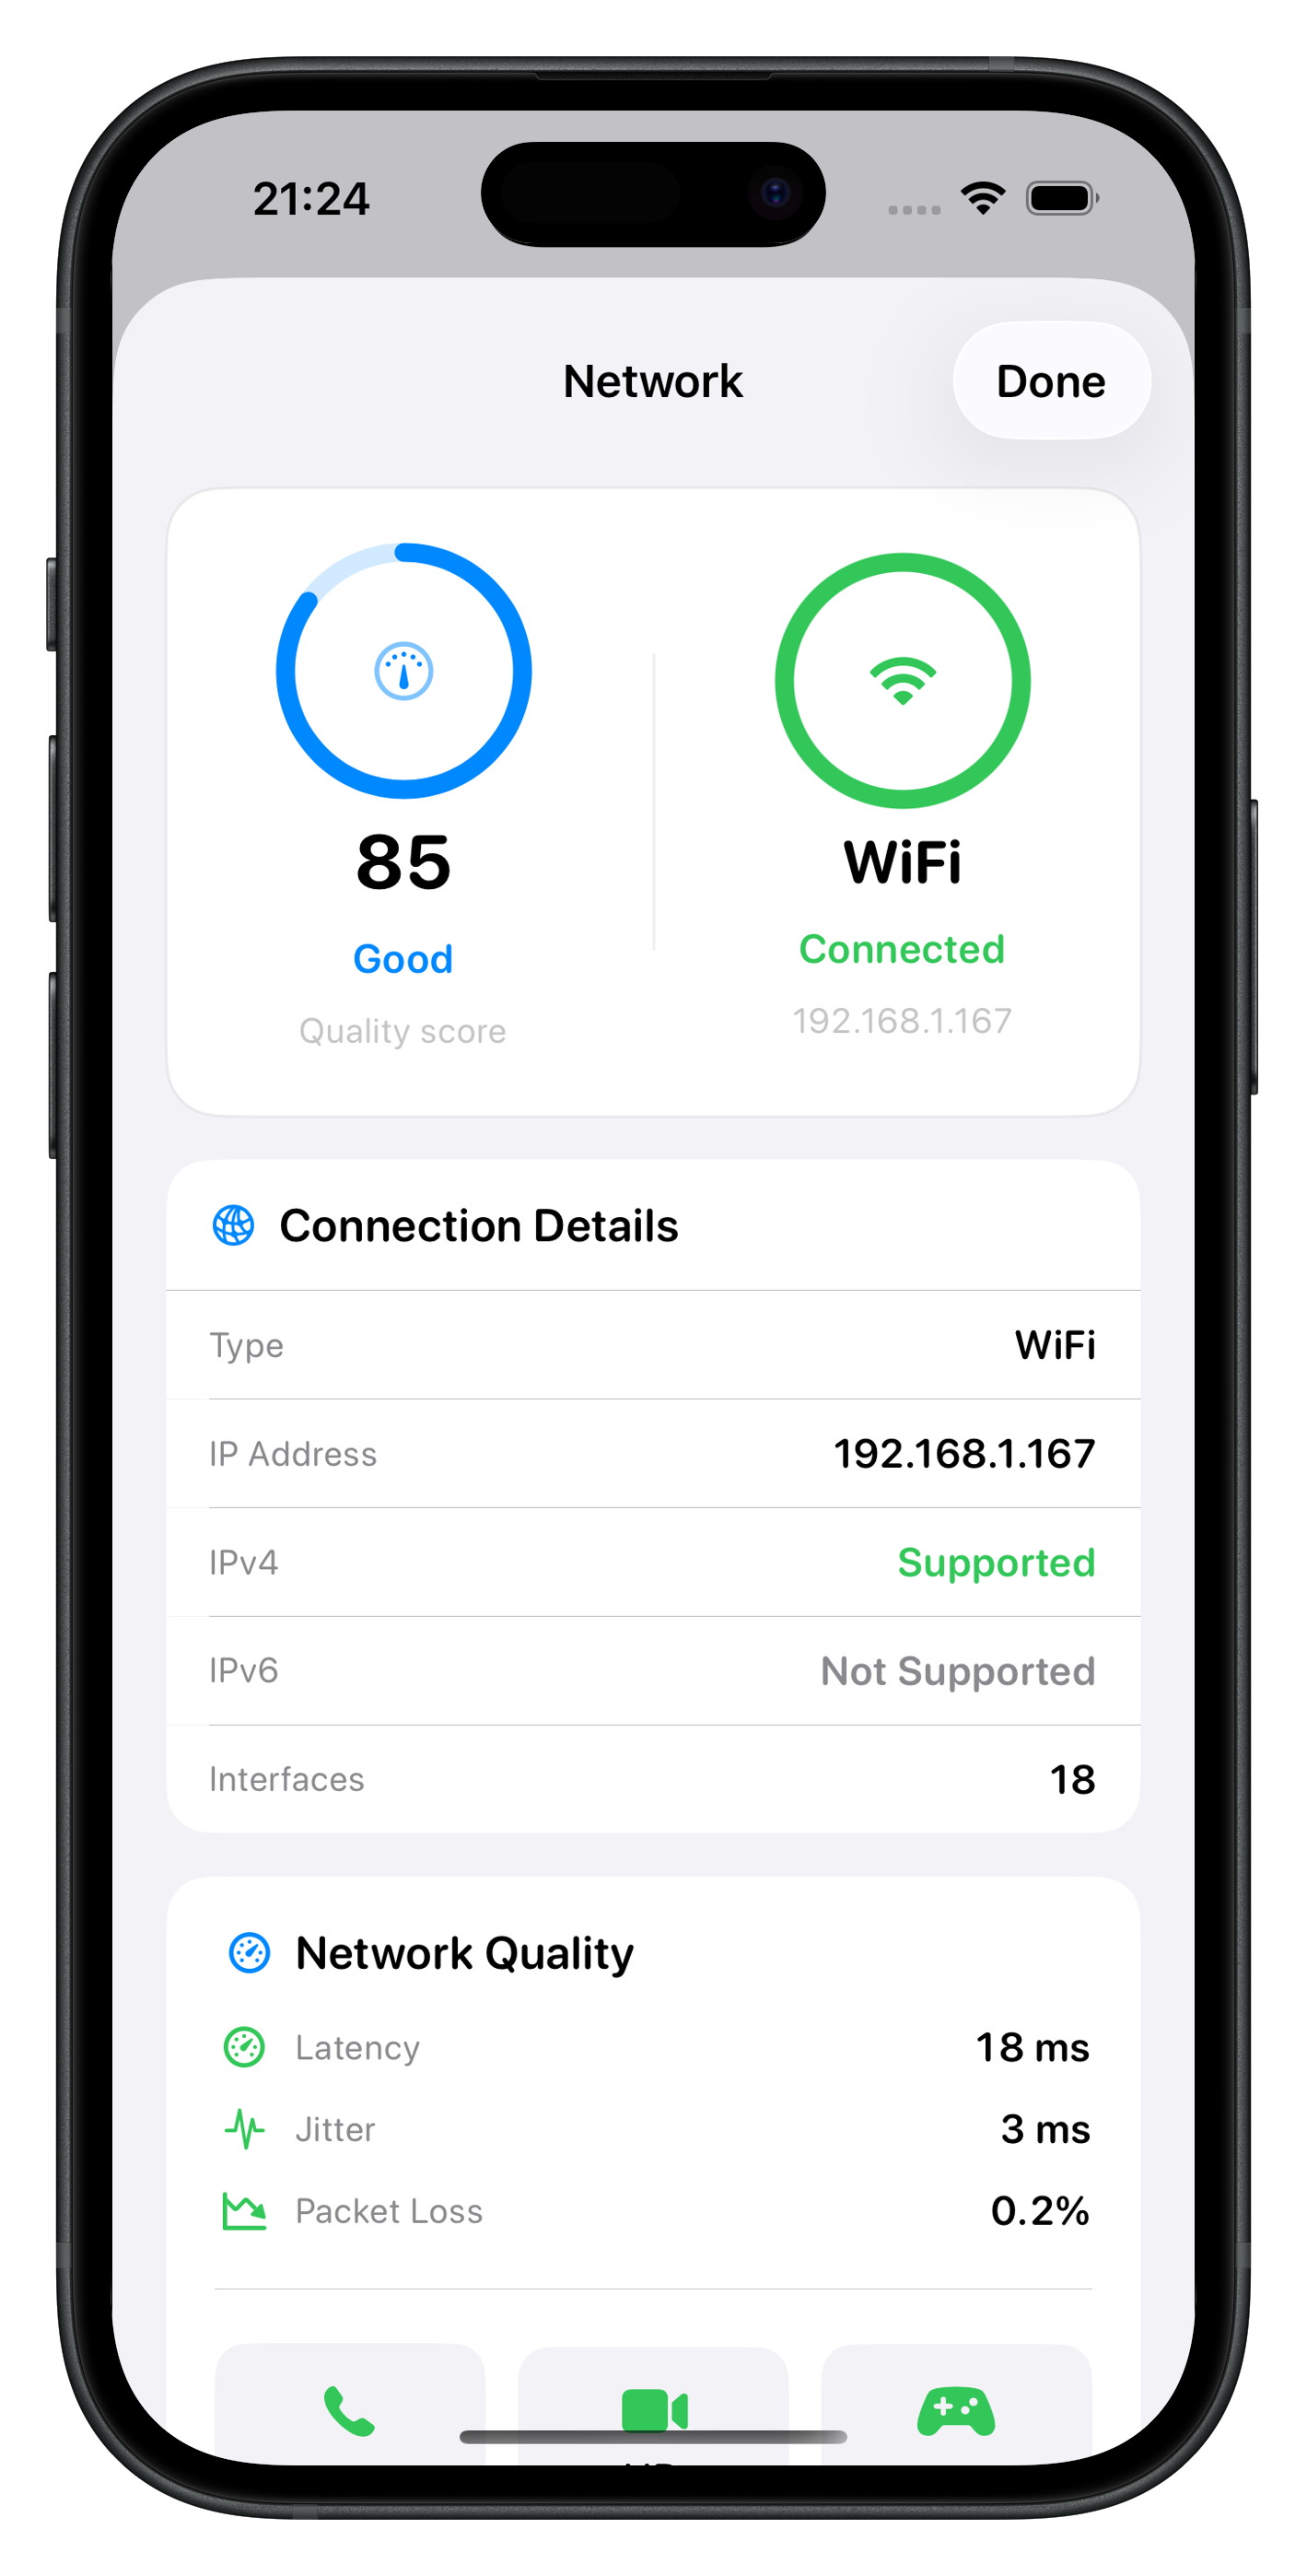
The Network detail view shows your current connection type (WiFi or Cellular), IP address, and an overall quality score (0–100). Quick stats include Interfaces count and IPv4/IPv6 support. The quality card breaks down Latency, Jitter, and Packet Loss, with suitability ratings for VoIP, Video, and Gaming.
Network Detail
Connection quality score, latency metrics, and interface list
📡
Quality Score
A 0–100 score based on latency, jitter, and packet loss. Color-coded ring shows Good, Fair, or Poor quality.
🎮
Suitability Ratings
See how your connection performs for VoIP calls, HD video streaming, and online gaming.
🔌
Network Interfaces
Browse all active and inactive network interfaces with their IP addresses and status.
Device Information
A comprehensive overview of your iPhone's hardware and software specifications.
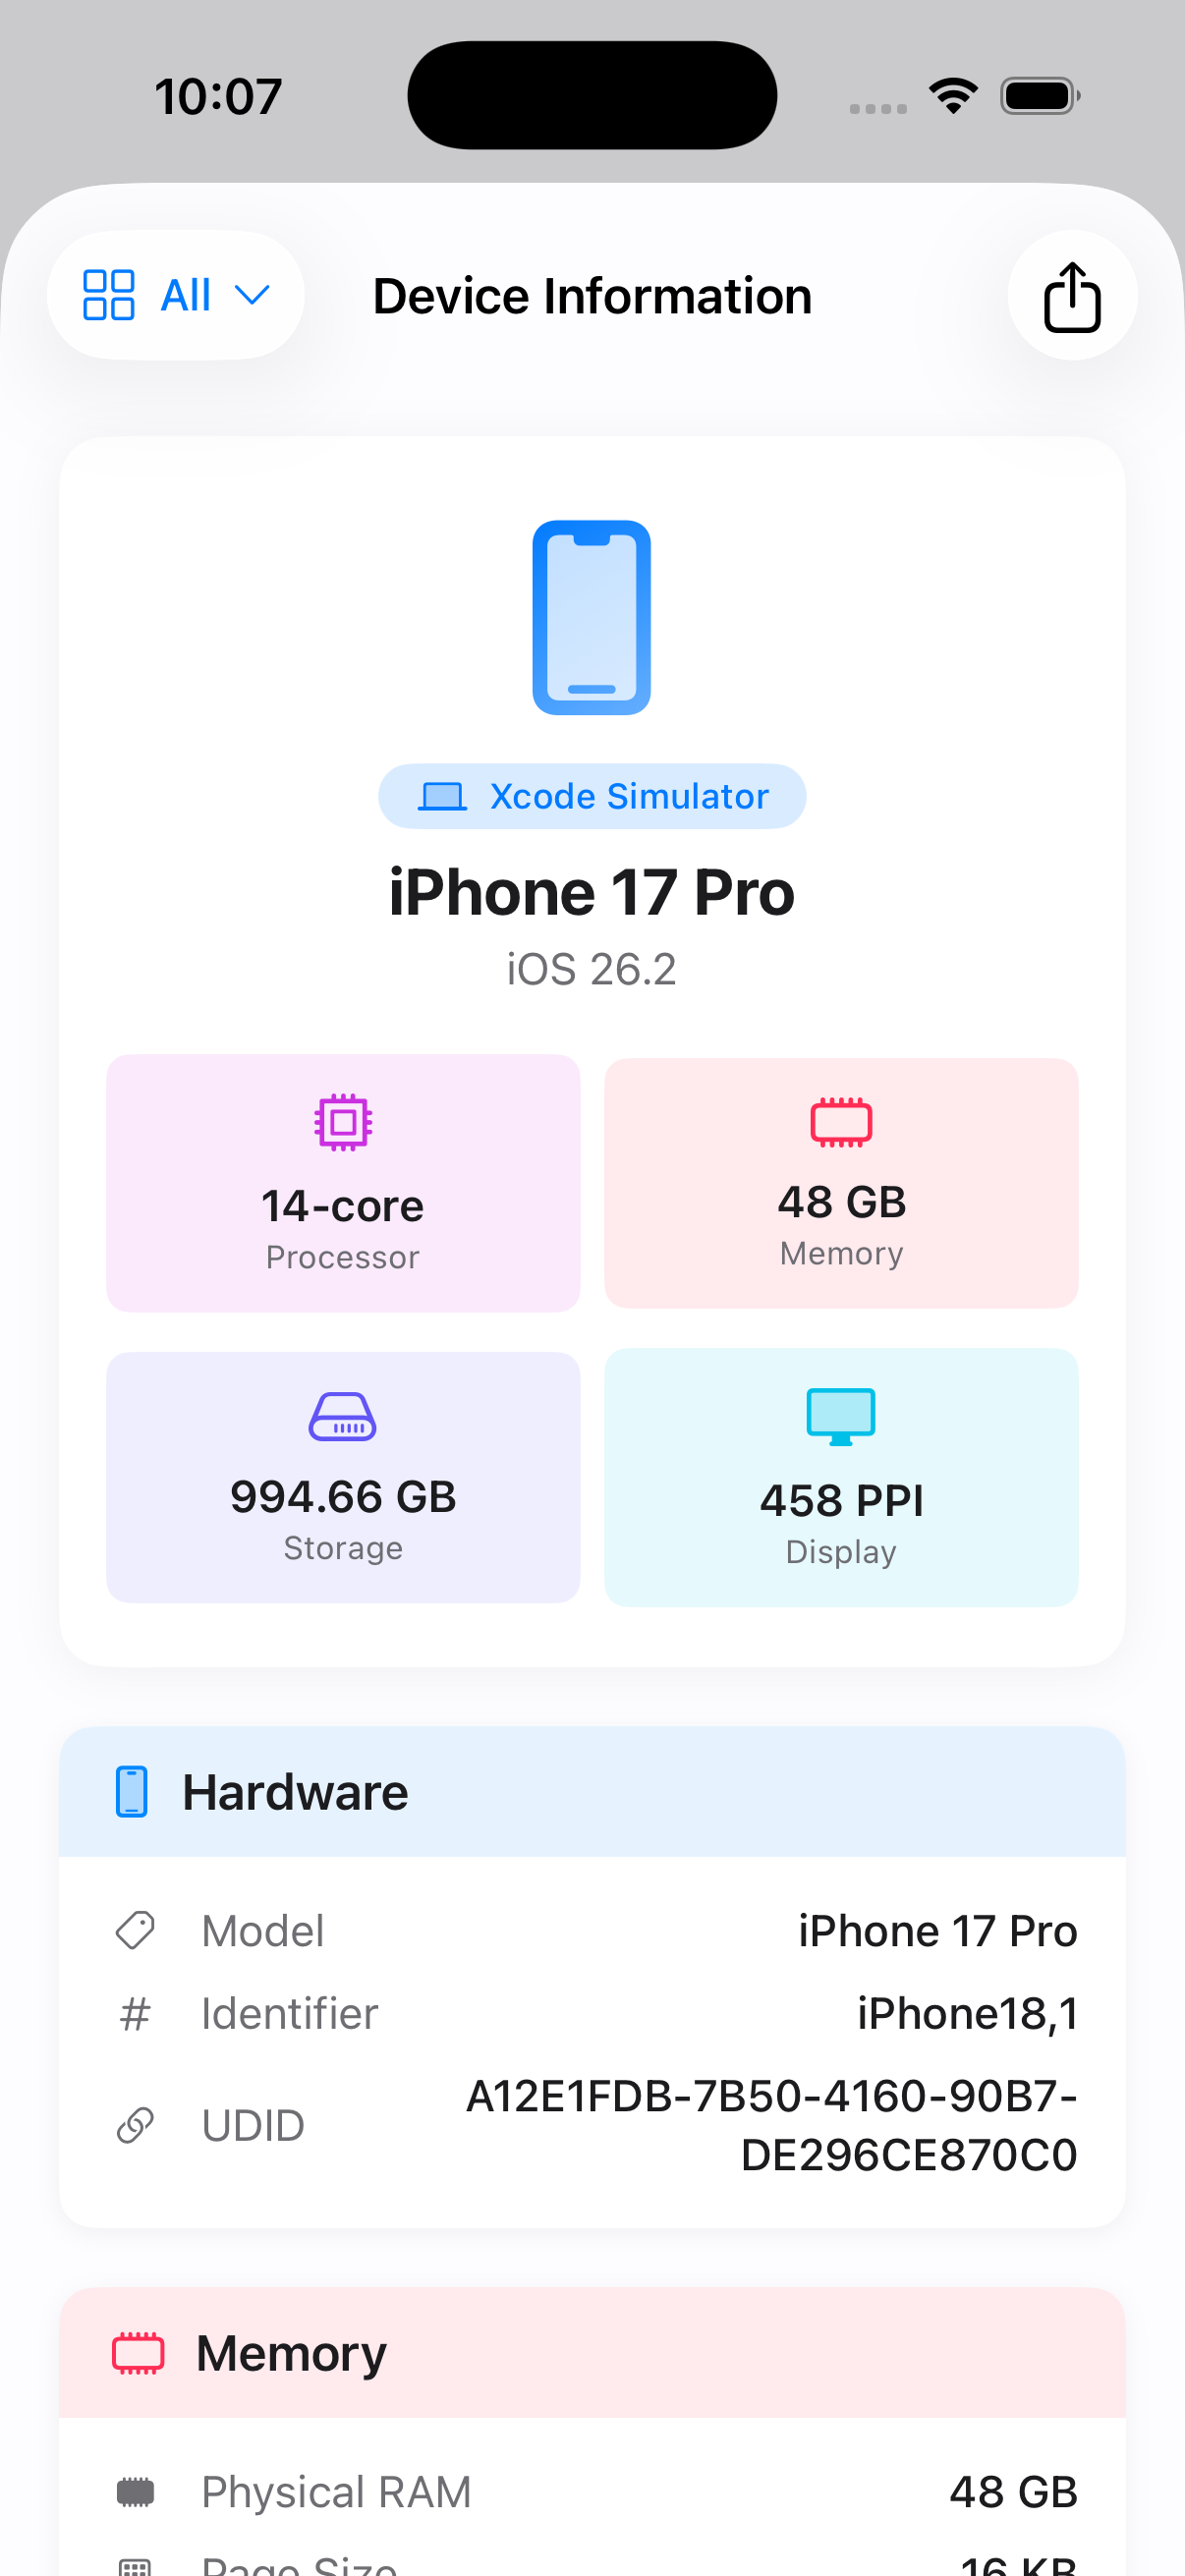
The Device Information screen displays your device model, iOS version, and detailed specs organized into categories: Hardware, Memory, Display, Chip, Camera, Connectivity, and more. Live Metal GPU data and bundled chip spec estimates (peak TFLOPS, memory bandwidth) appear where available. Tap any value to copy it to your clipboard, or share a text or PDF report.
Device Information
Complete hardware and software specs at a glance
📋
Copy & Share
Tap any value to copy it. Use the share menu to export a full device report as plain text or PDF.
🔎
Category Filter
Filter by category using the dropdown: All, Hardware, Memory, Display, Camera, Connectivity, Battery, Storage, and Software.
Network Tools
Professional diagnostic tools for network analysis and troubleshooting.
StatBoard includes 16 network tools organized into Diagnostic, Security, Testing & Performance, and Discovery categories. Search the hub to jump to any tool quickly. These tools communicate directly with the servers you specify. No data passes through third-party servers.
Network Tools
16 tools across four categories with search
✓ Ping
✓ Traceroute
✓ DNS Lookup
✓ WHOIS
✓ MAC Lookup
✓ Port Scanner
✓ Subnet Calculator
✓ SSL Certificate
✓ TLS Inspector
✓ Blacklist Check
✓ HTTP Tester
✓ Speed Test
✓ Network Diagnostics
✓ Bonjour Browser
✓ LAN Scanner
✓ NAT / STUN
✓ DNS Propagation
Ping & Latency Testing
Test connectivity to any host or IP address. Configure packet count and timeout. View real-time latency chart and statistics including sent, received, and packet loss.
Ping Tool
Real-time latency chart with configurable packets and timeout
DNS Lookup
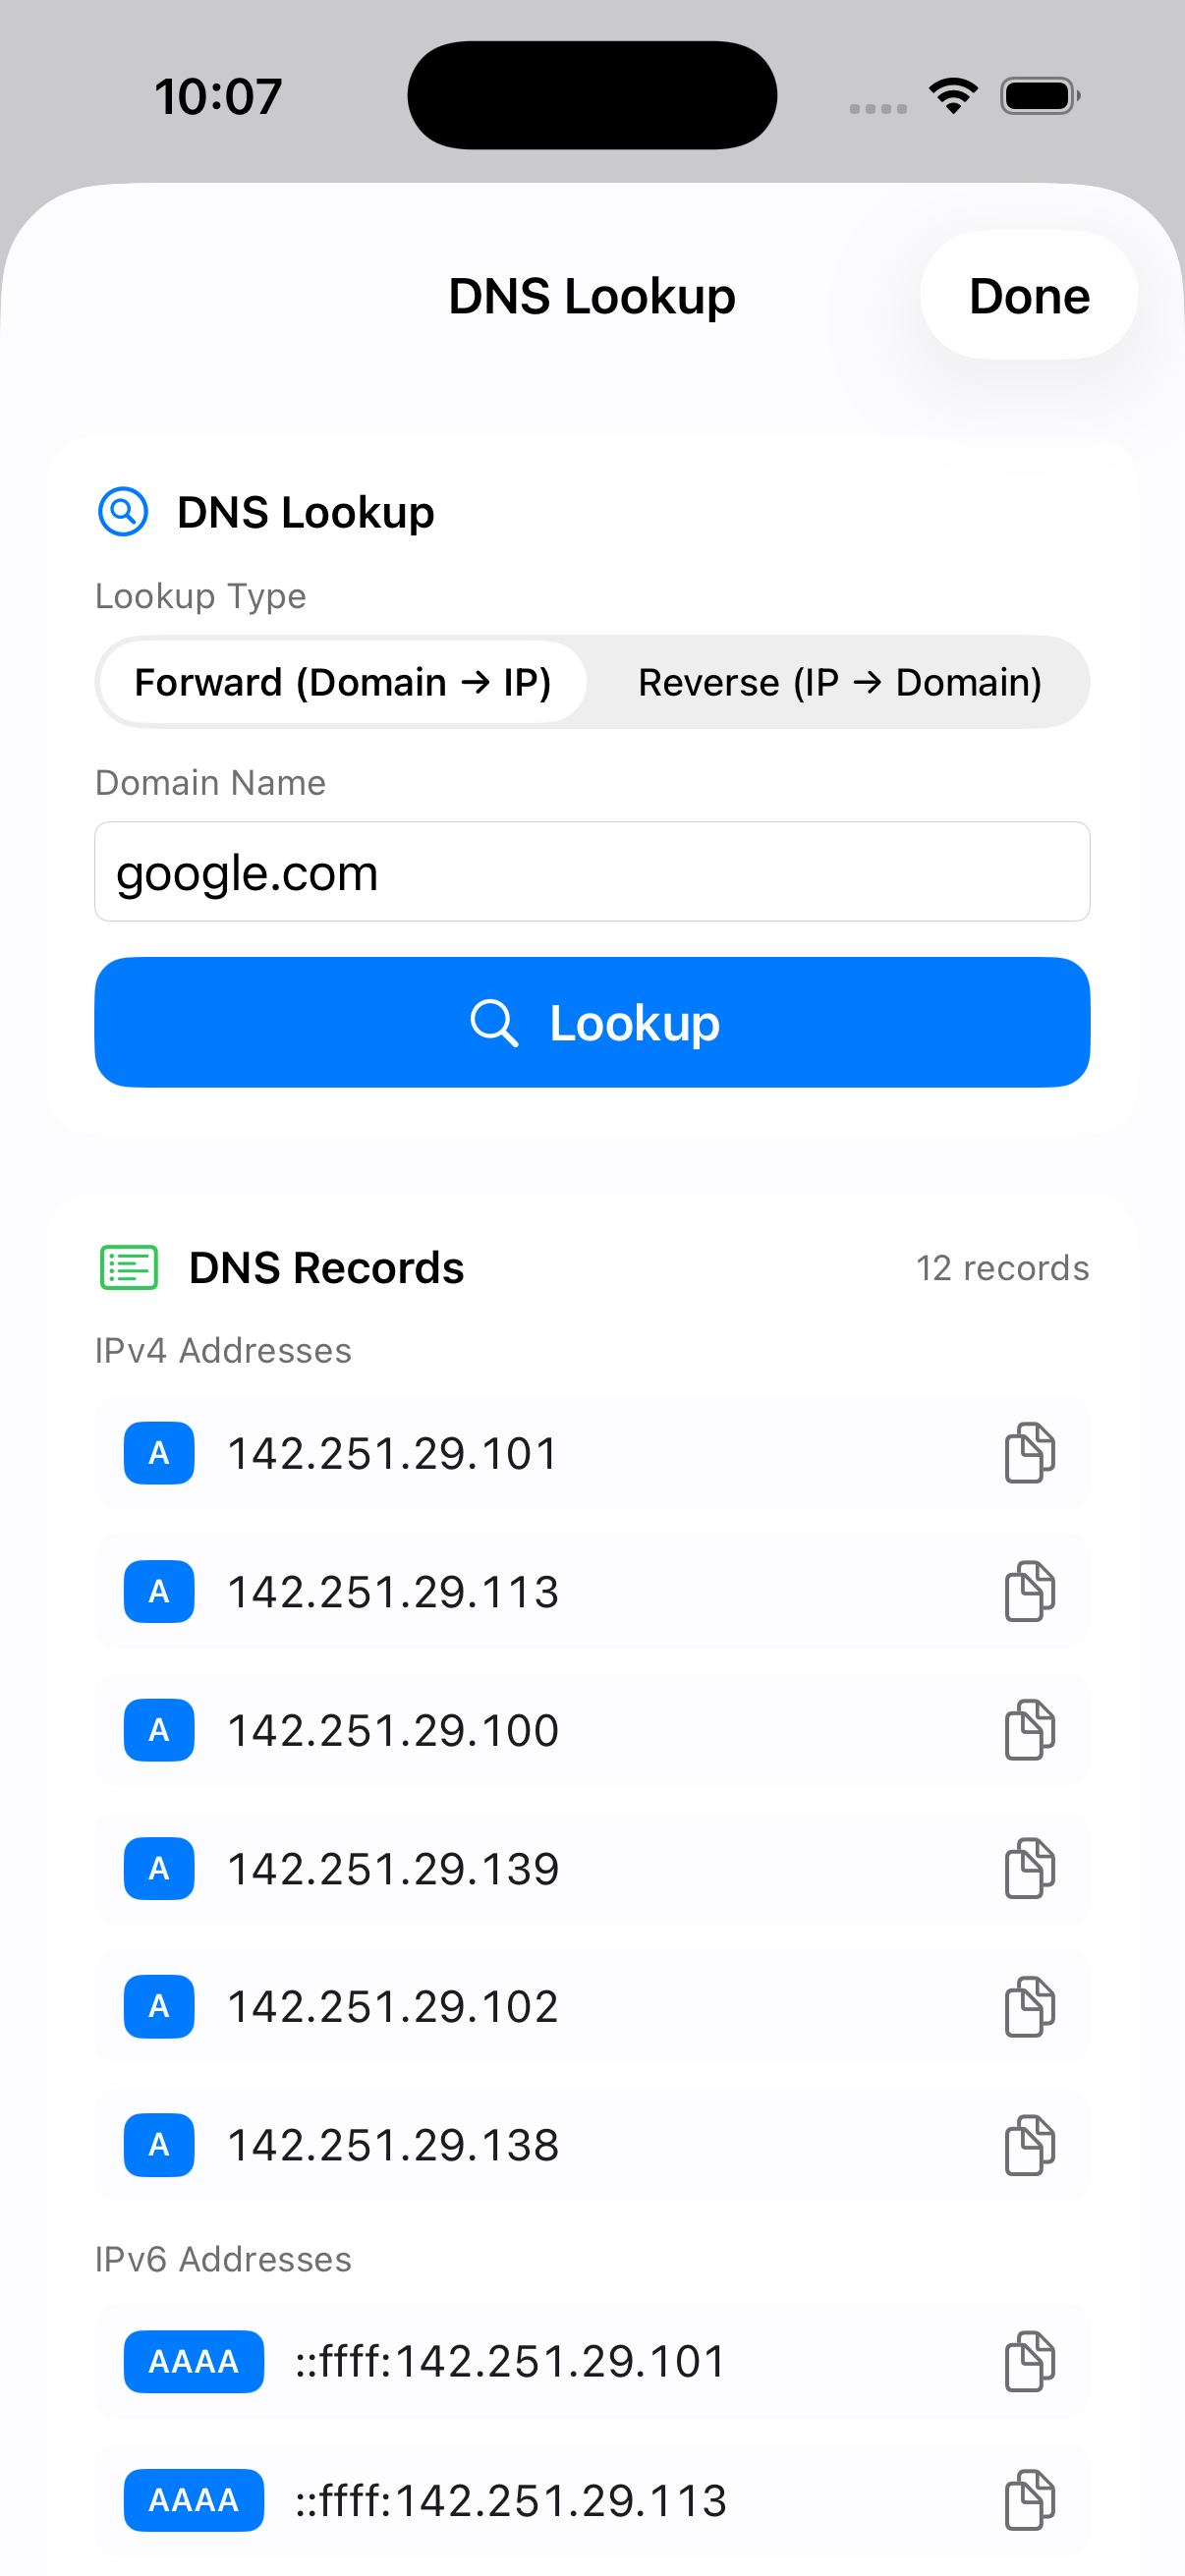
Resolve domain names to IP addresses (Forward lookup) or reverse-lookup IPs to domains. View all IPv4 and IPv6 A/AAAA records with copy support.
DNS Lookup
Forward and reverse DNS resolution with record details
WHOIS Lookup
Query domain registration information including registrar, domain age, registration dates, and IANA details. Supports automatic WHOIS server selection.
WHOIS Lookup
Domain registration info with registrar details
MAC Address Lookup
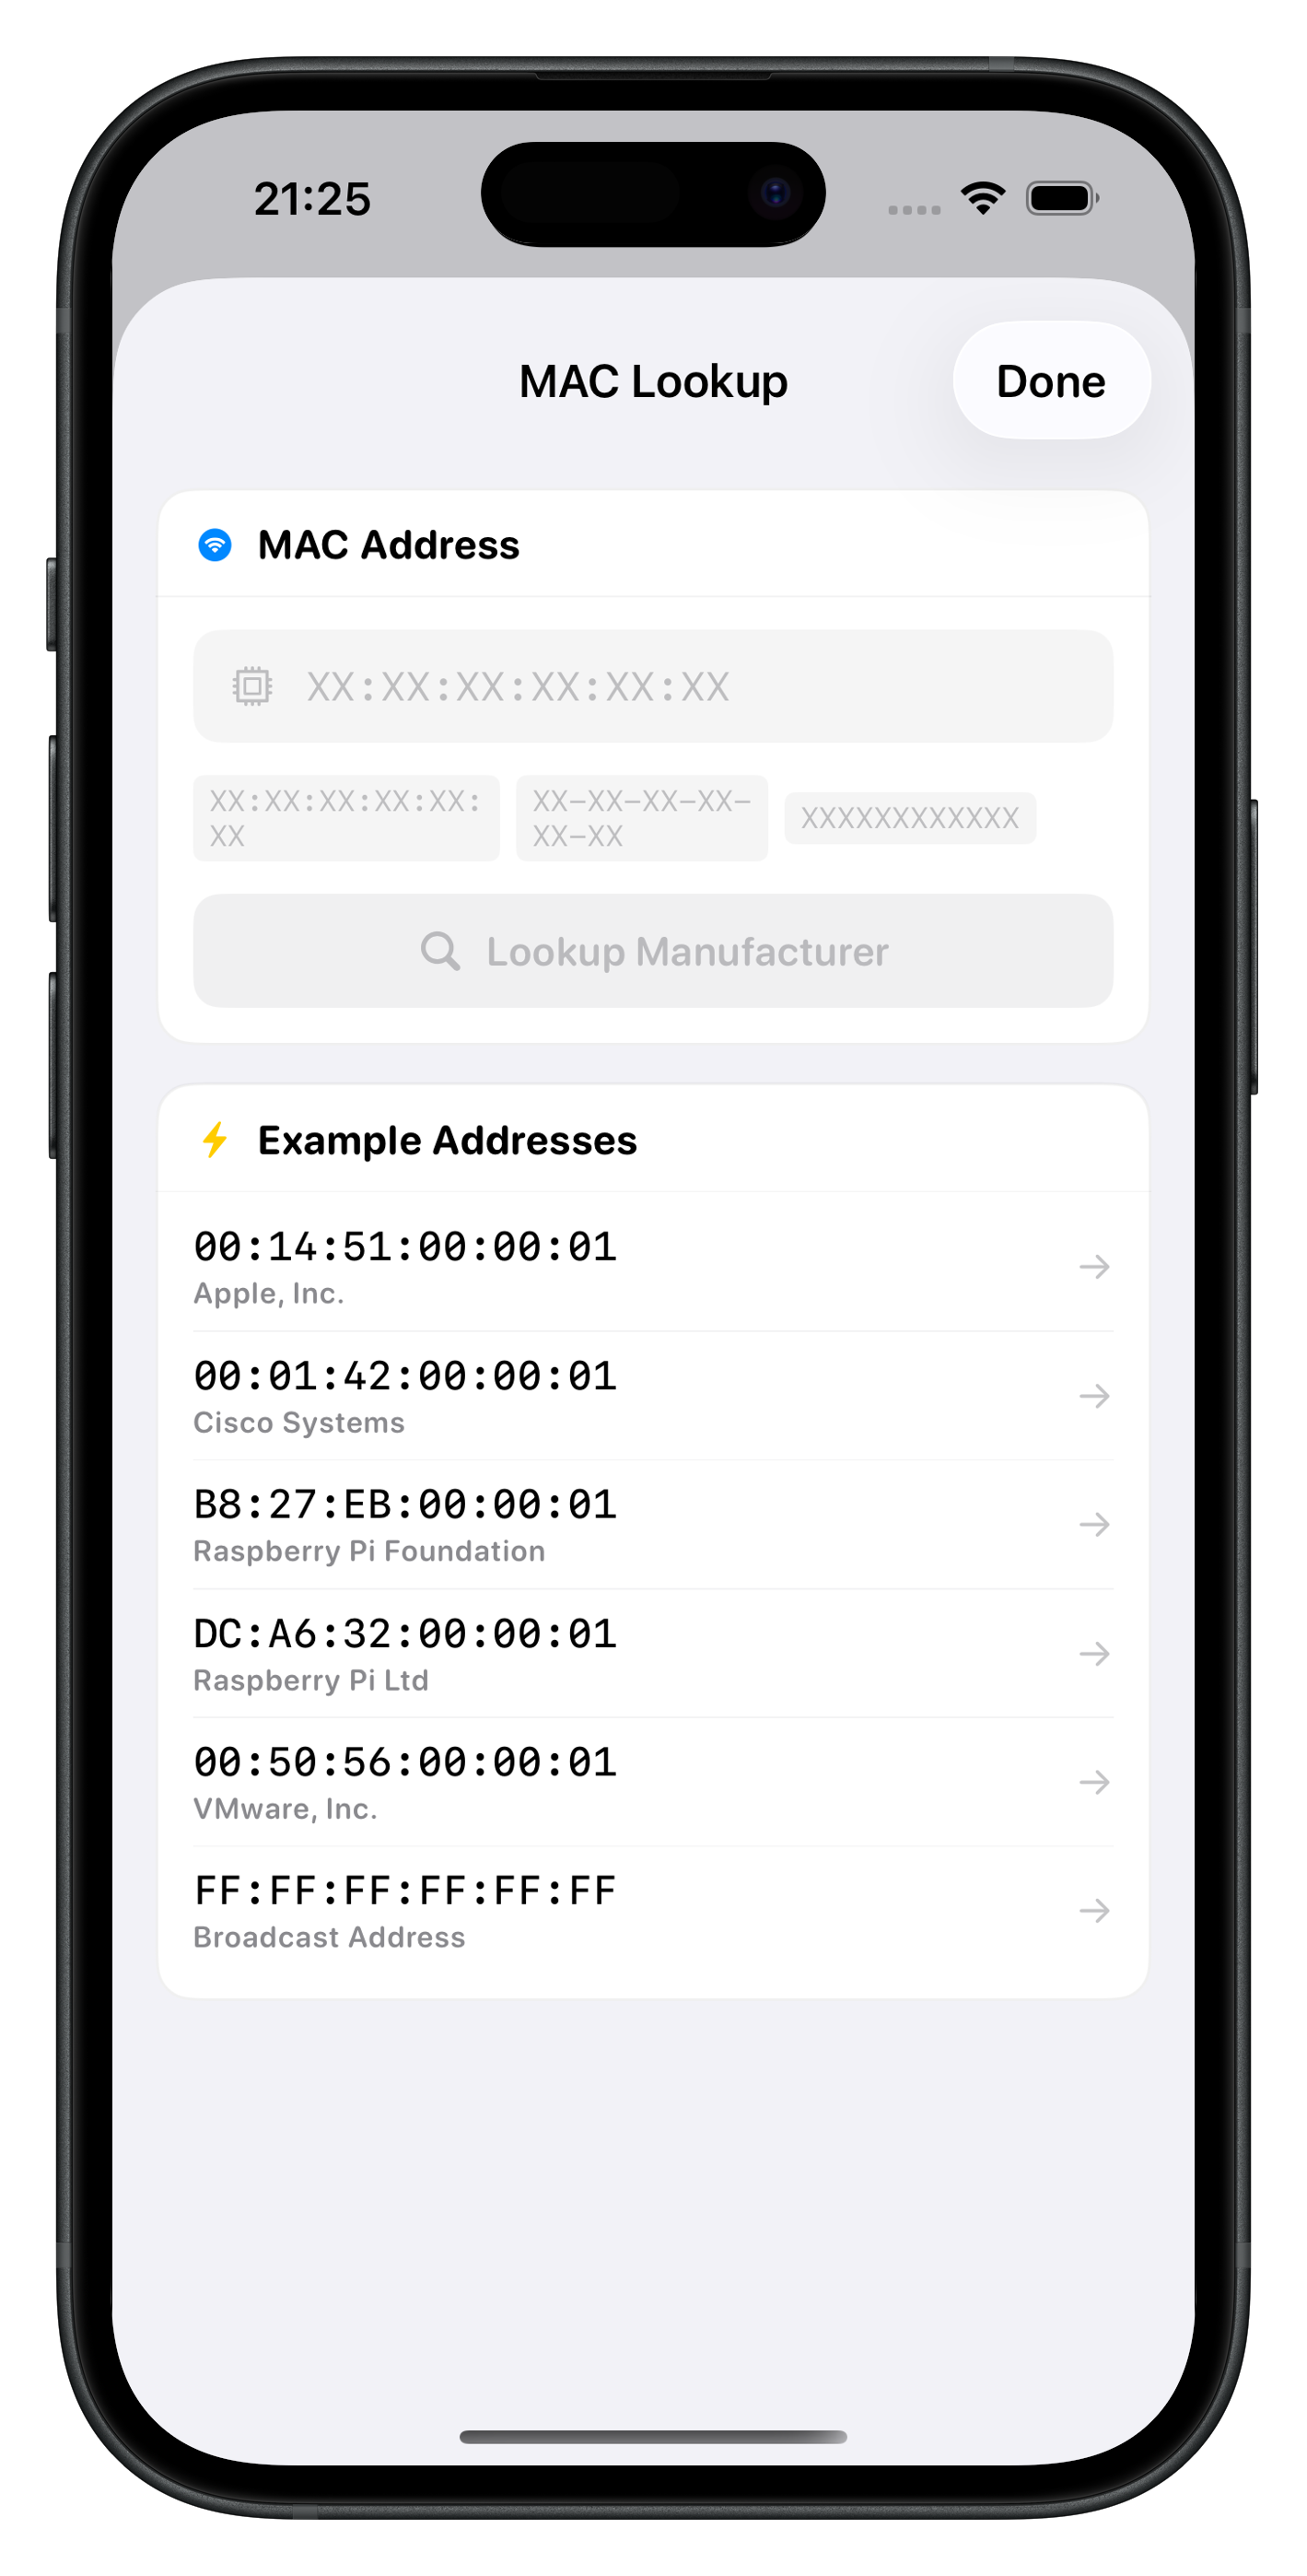
Identify device manufacturers from MAC addresses. Supports multiple formats (colon-separated, dash-separated, dot-separated, plain). View manufacturer details and address formats.
MAC Address Lookup
Identify hardware manufacturers from MAC addresses
Port Scanner
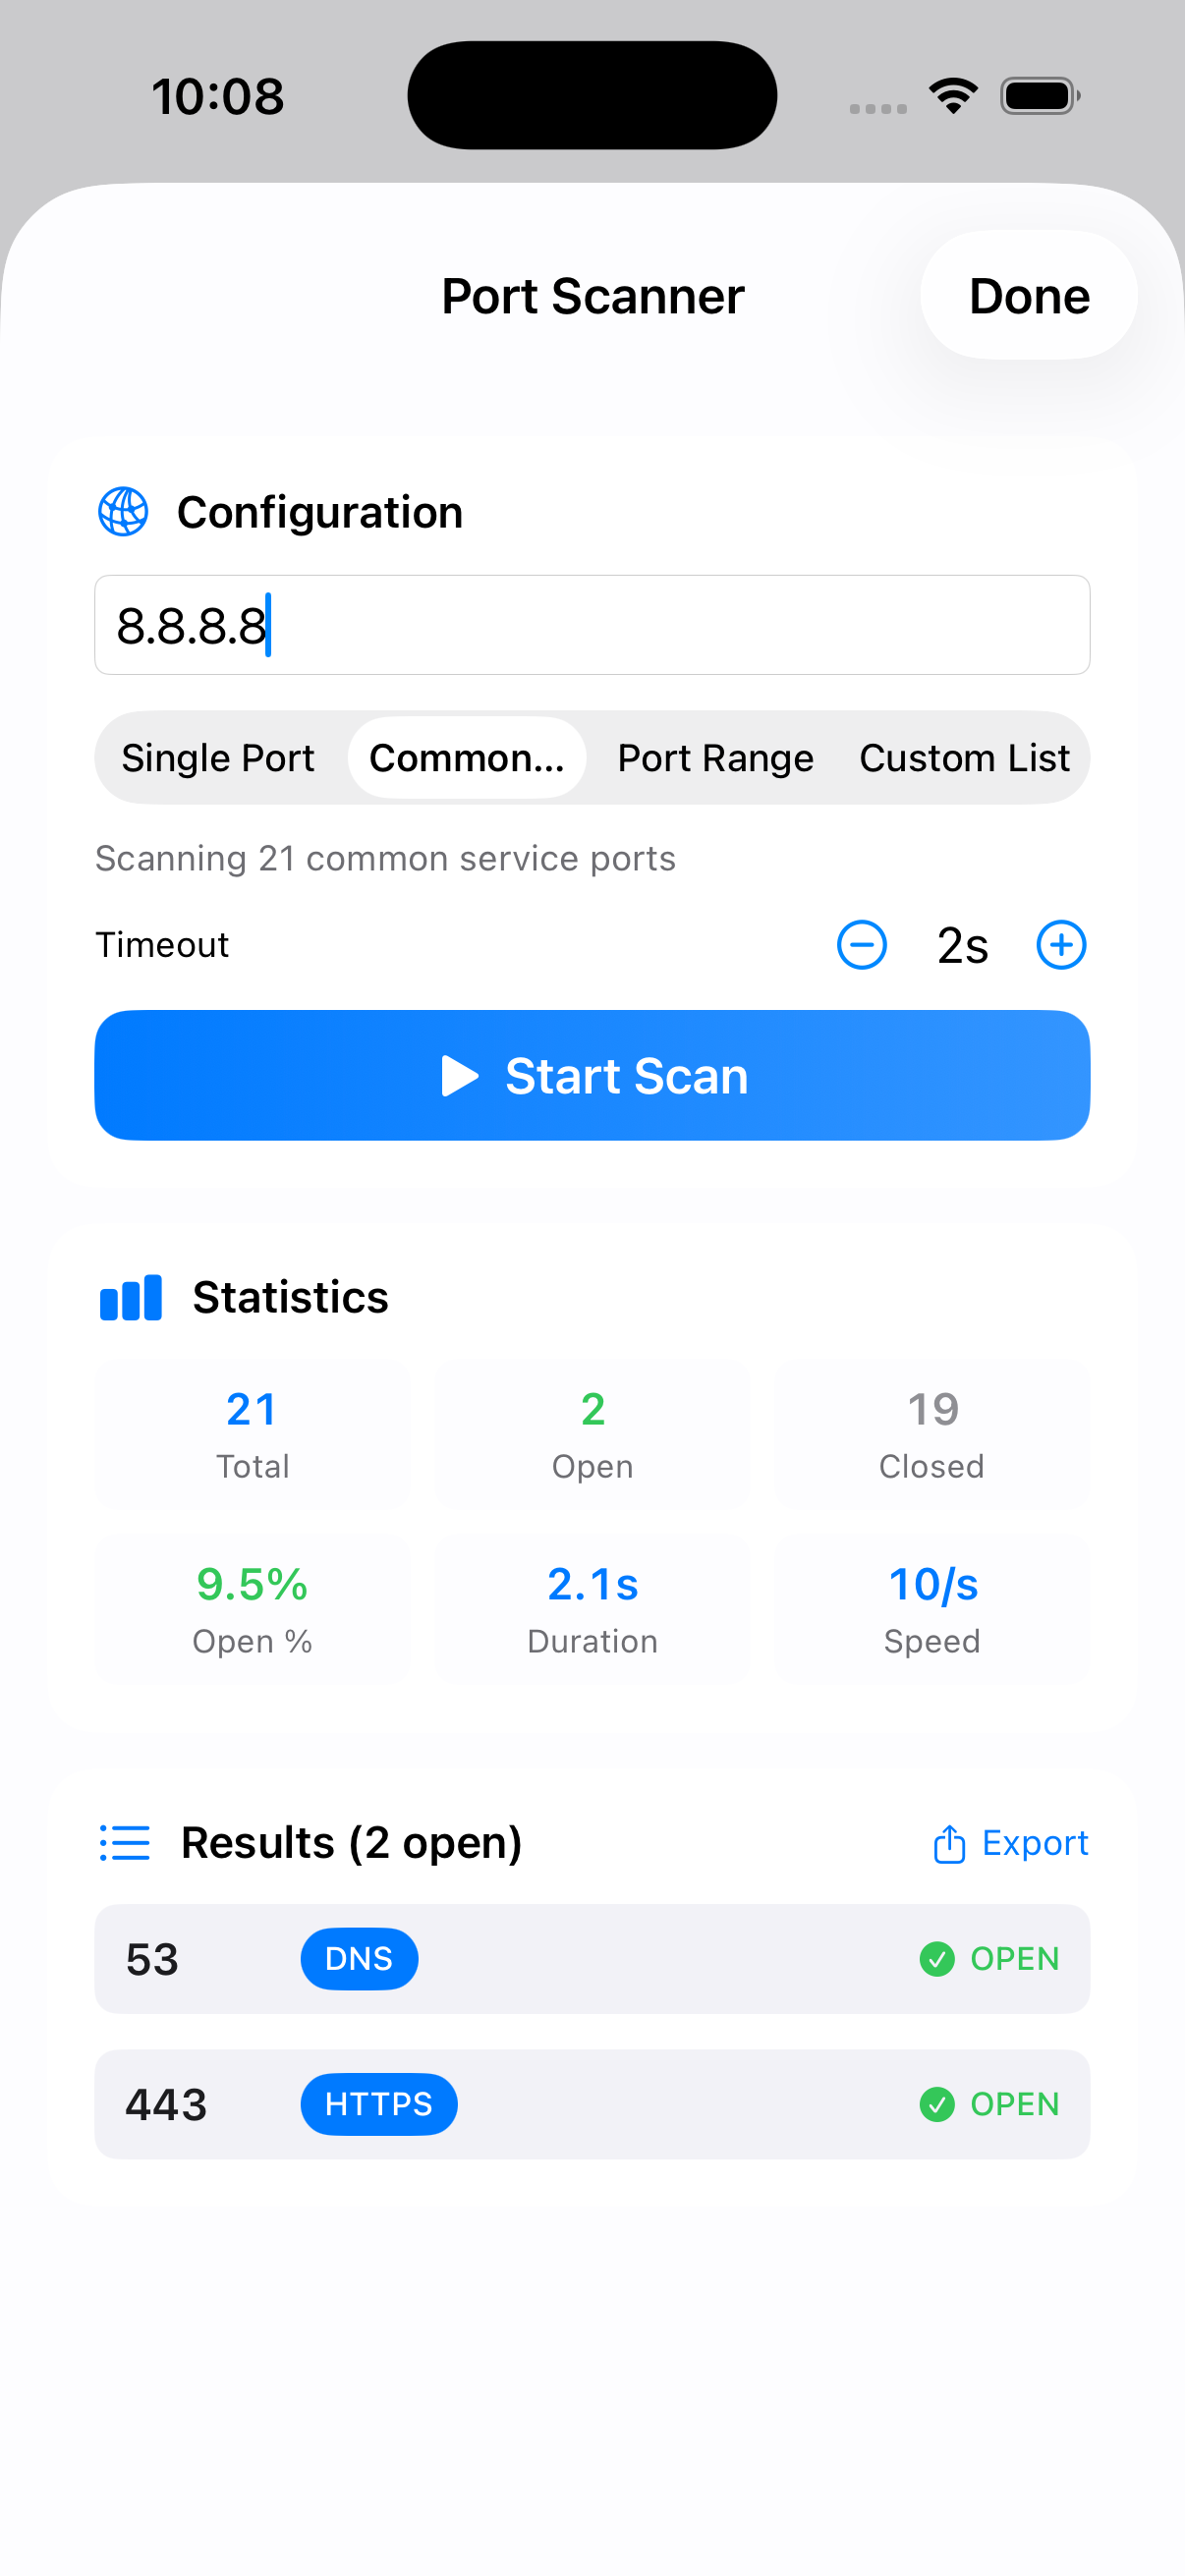
Scan for open ports on any host. Choose single port, common ports, port range, or a custom list. View statistics with open/closed counts, scan duration, and speed. Export results for further analysis.
Port Scanner
Scan common ports with detailed results and export
Subnet Calculator
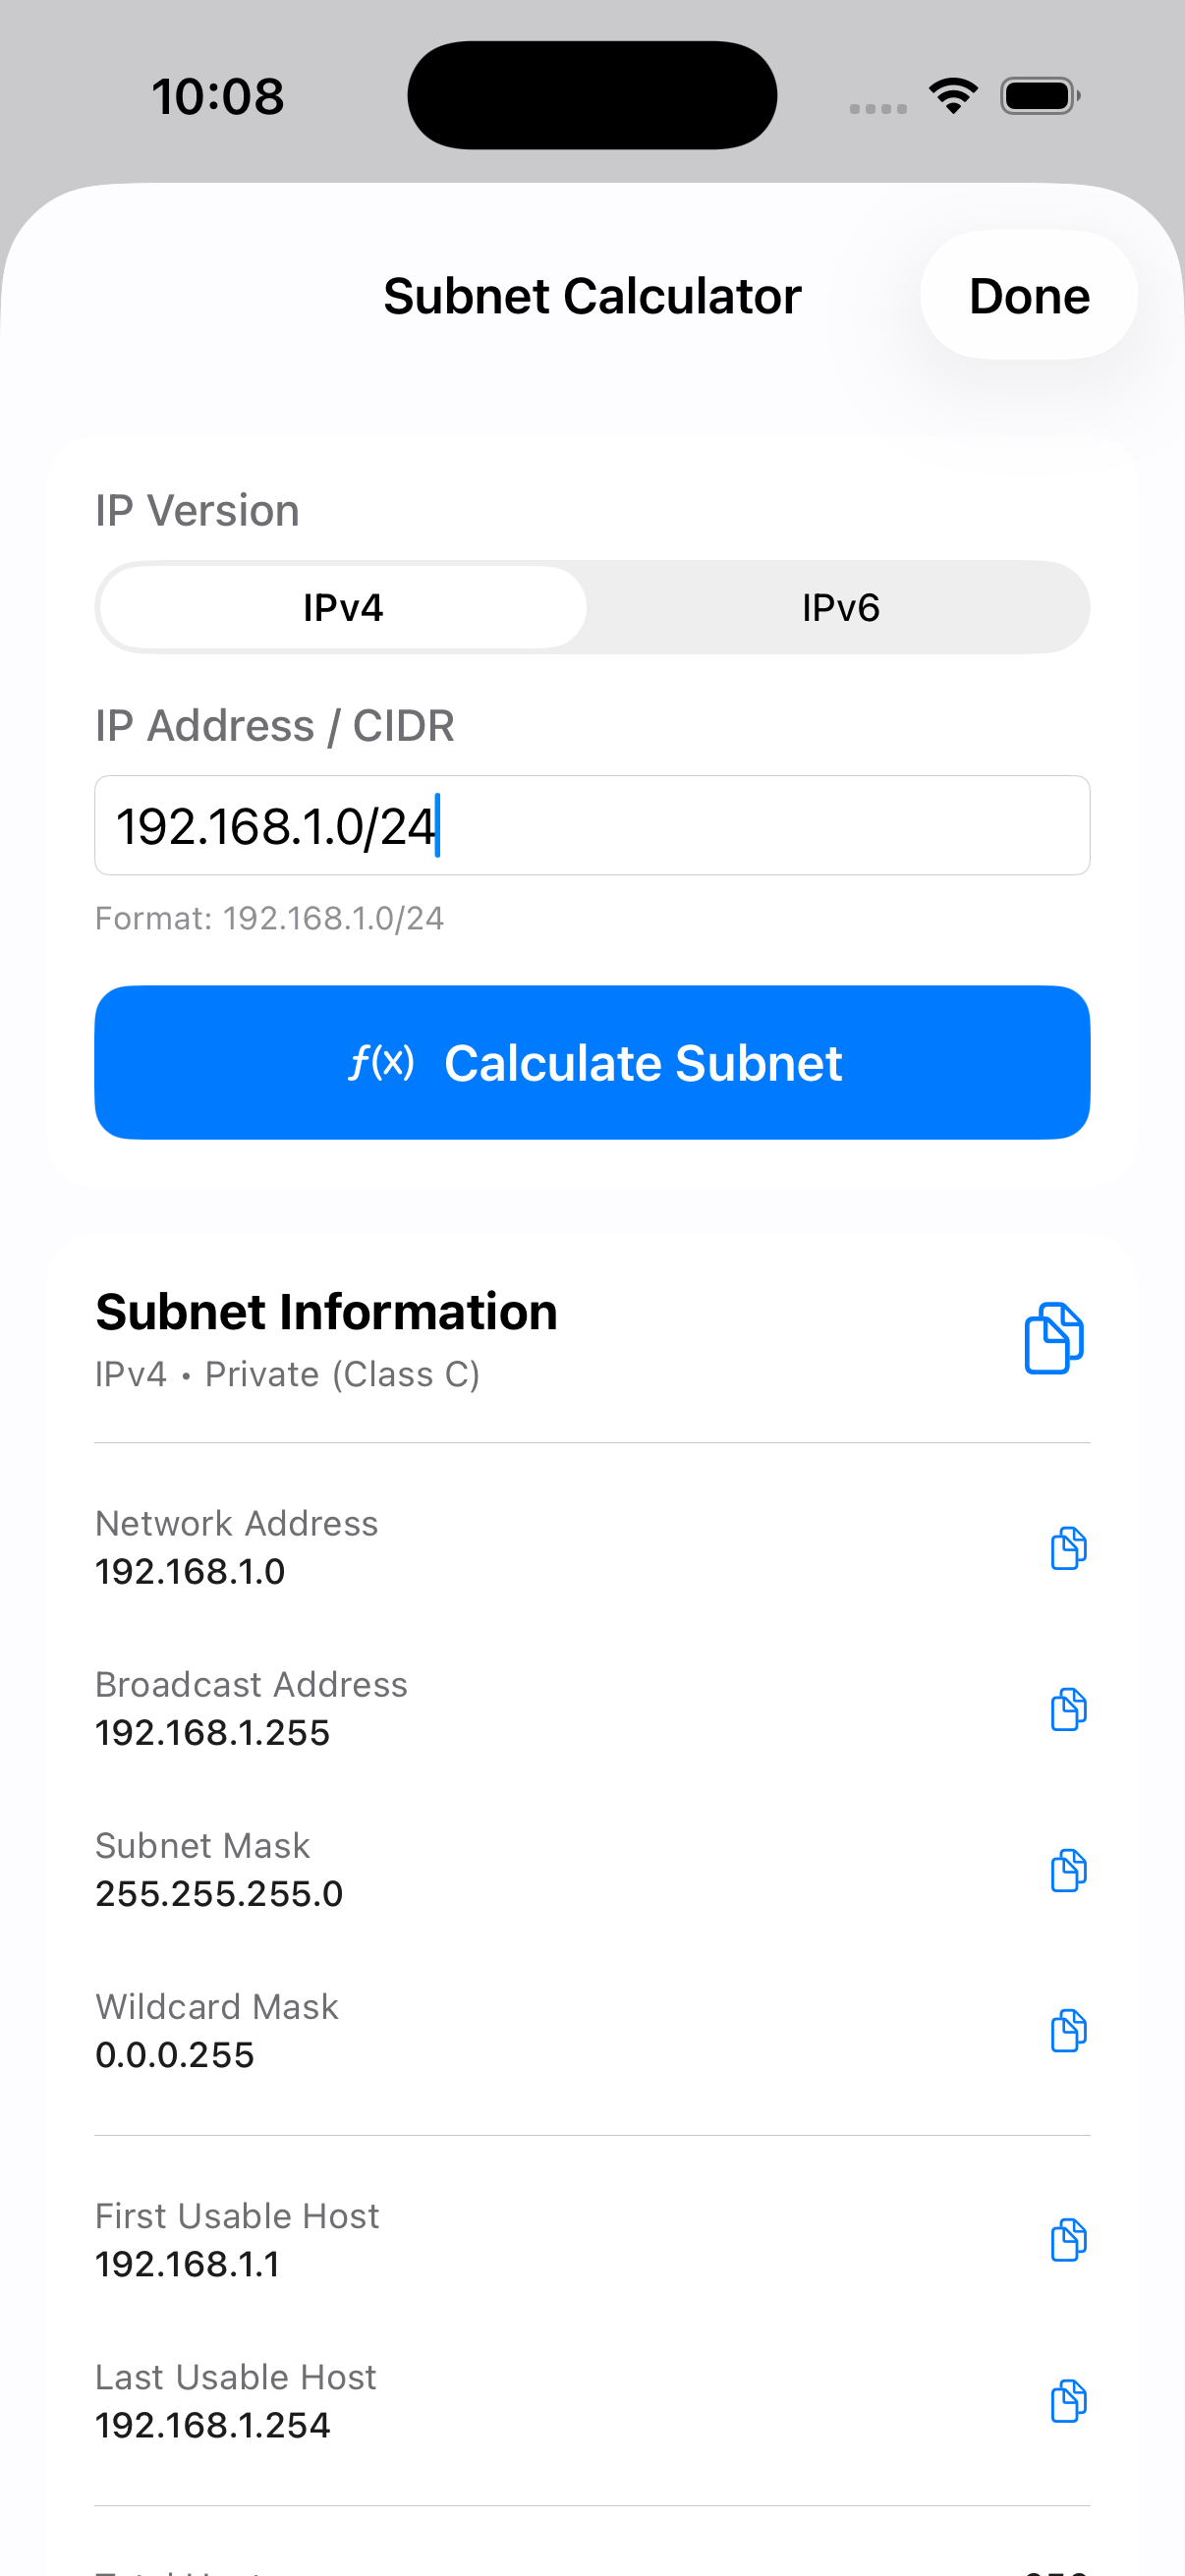
Calculate subnet information for IPv4 and IPv6 addresses. Enter an IP with CIDR notation to get network address, broadcast address, subnet mask, wildcard mask, and usable host range.
Subnet Calculator
IPv4/IPv6 subnet calculations with copyable results
SSL Certificate Viewer
Inspect SSL/TLS certificates for any website. View trust status, certificate chain, server certificate details, validity period, and SHA-256 fingerprints.
SSL Certificate Viewer
Inspect certificates with trust status and chain details
HTTP Request Tester
Send HTTP requests with full control over method (GET, POST, PUT, PATCH, DELETE, HEAD, OPTIONS), headers, and body. View response status, timing, headers, and body. Copy results as cURL commands.
HTTP Request Tester
Full HTTP client with method, headers, and response inspection
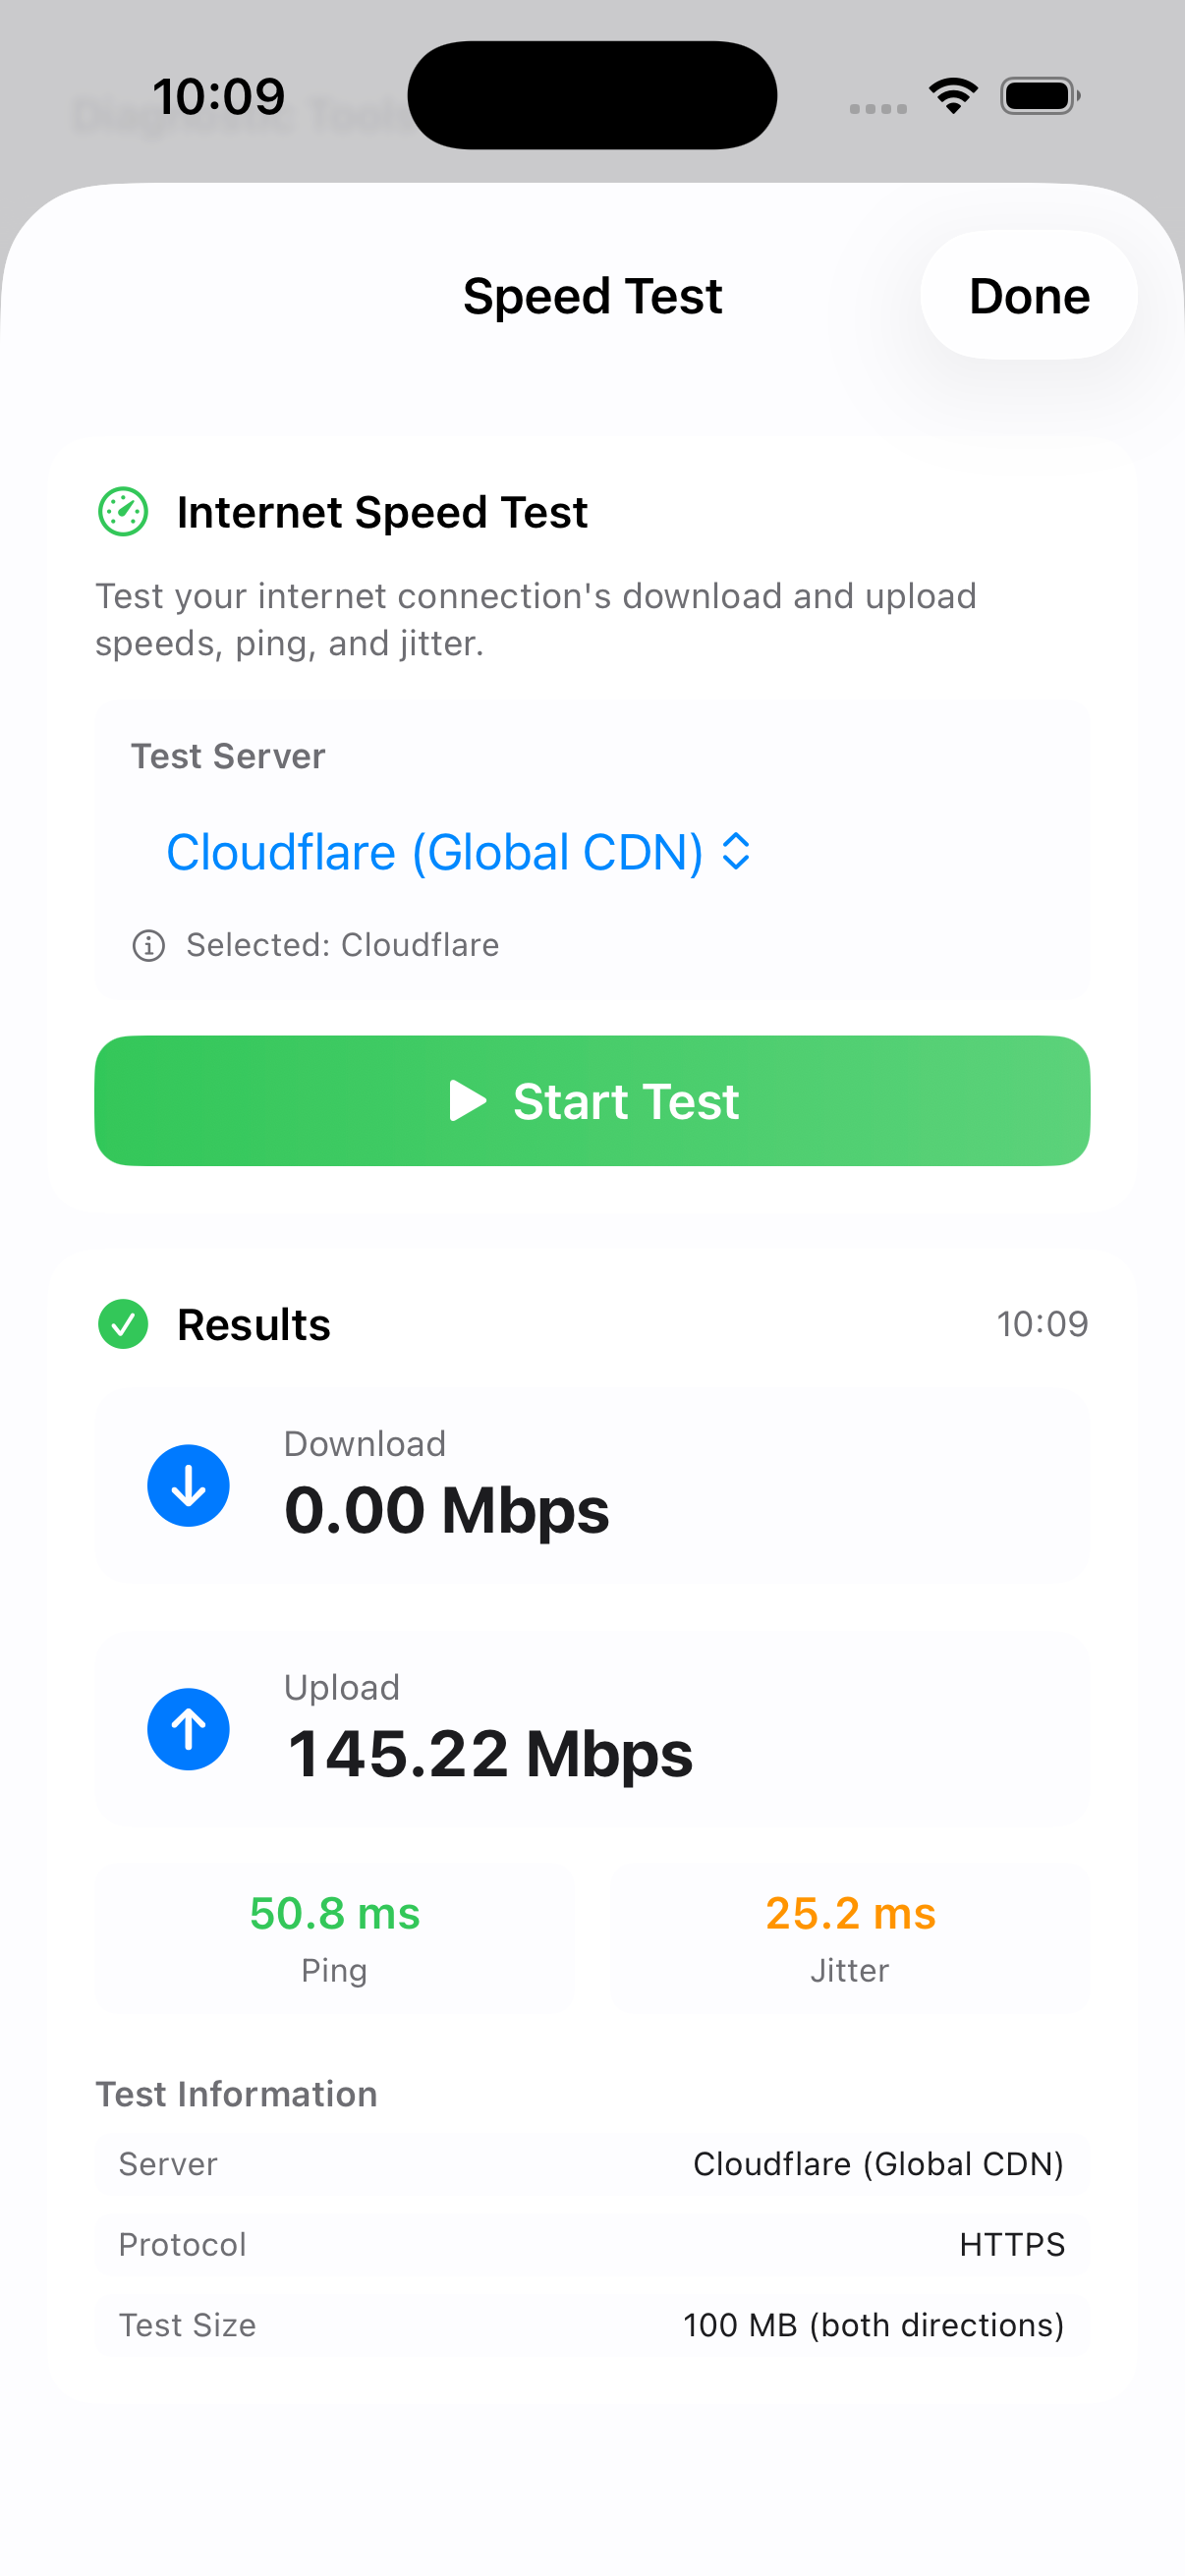
Internet Speed Test
Measure your download and upload speeds along with ping and jitter. View a live Mbps ring, throughput chart, path snapshot, and HTTP timing breakdown during the test.
Internet Speed Test
Accurate bandwidth testing with multiple server options
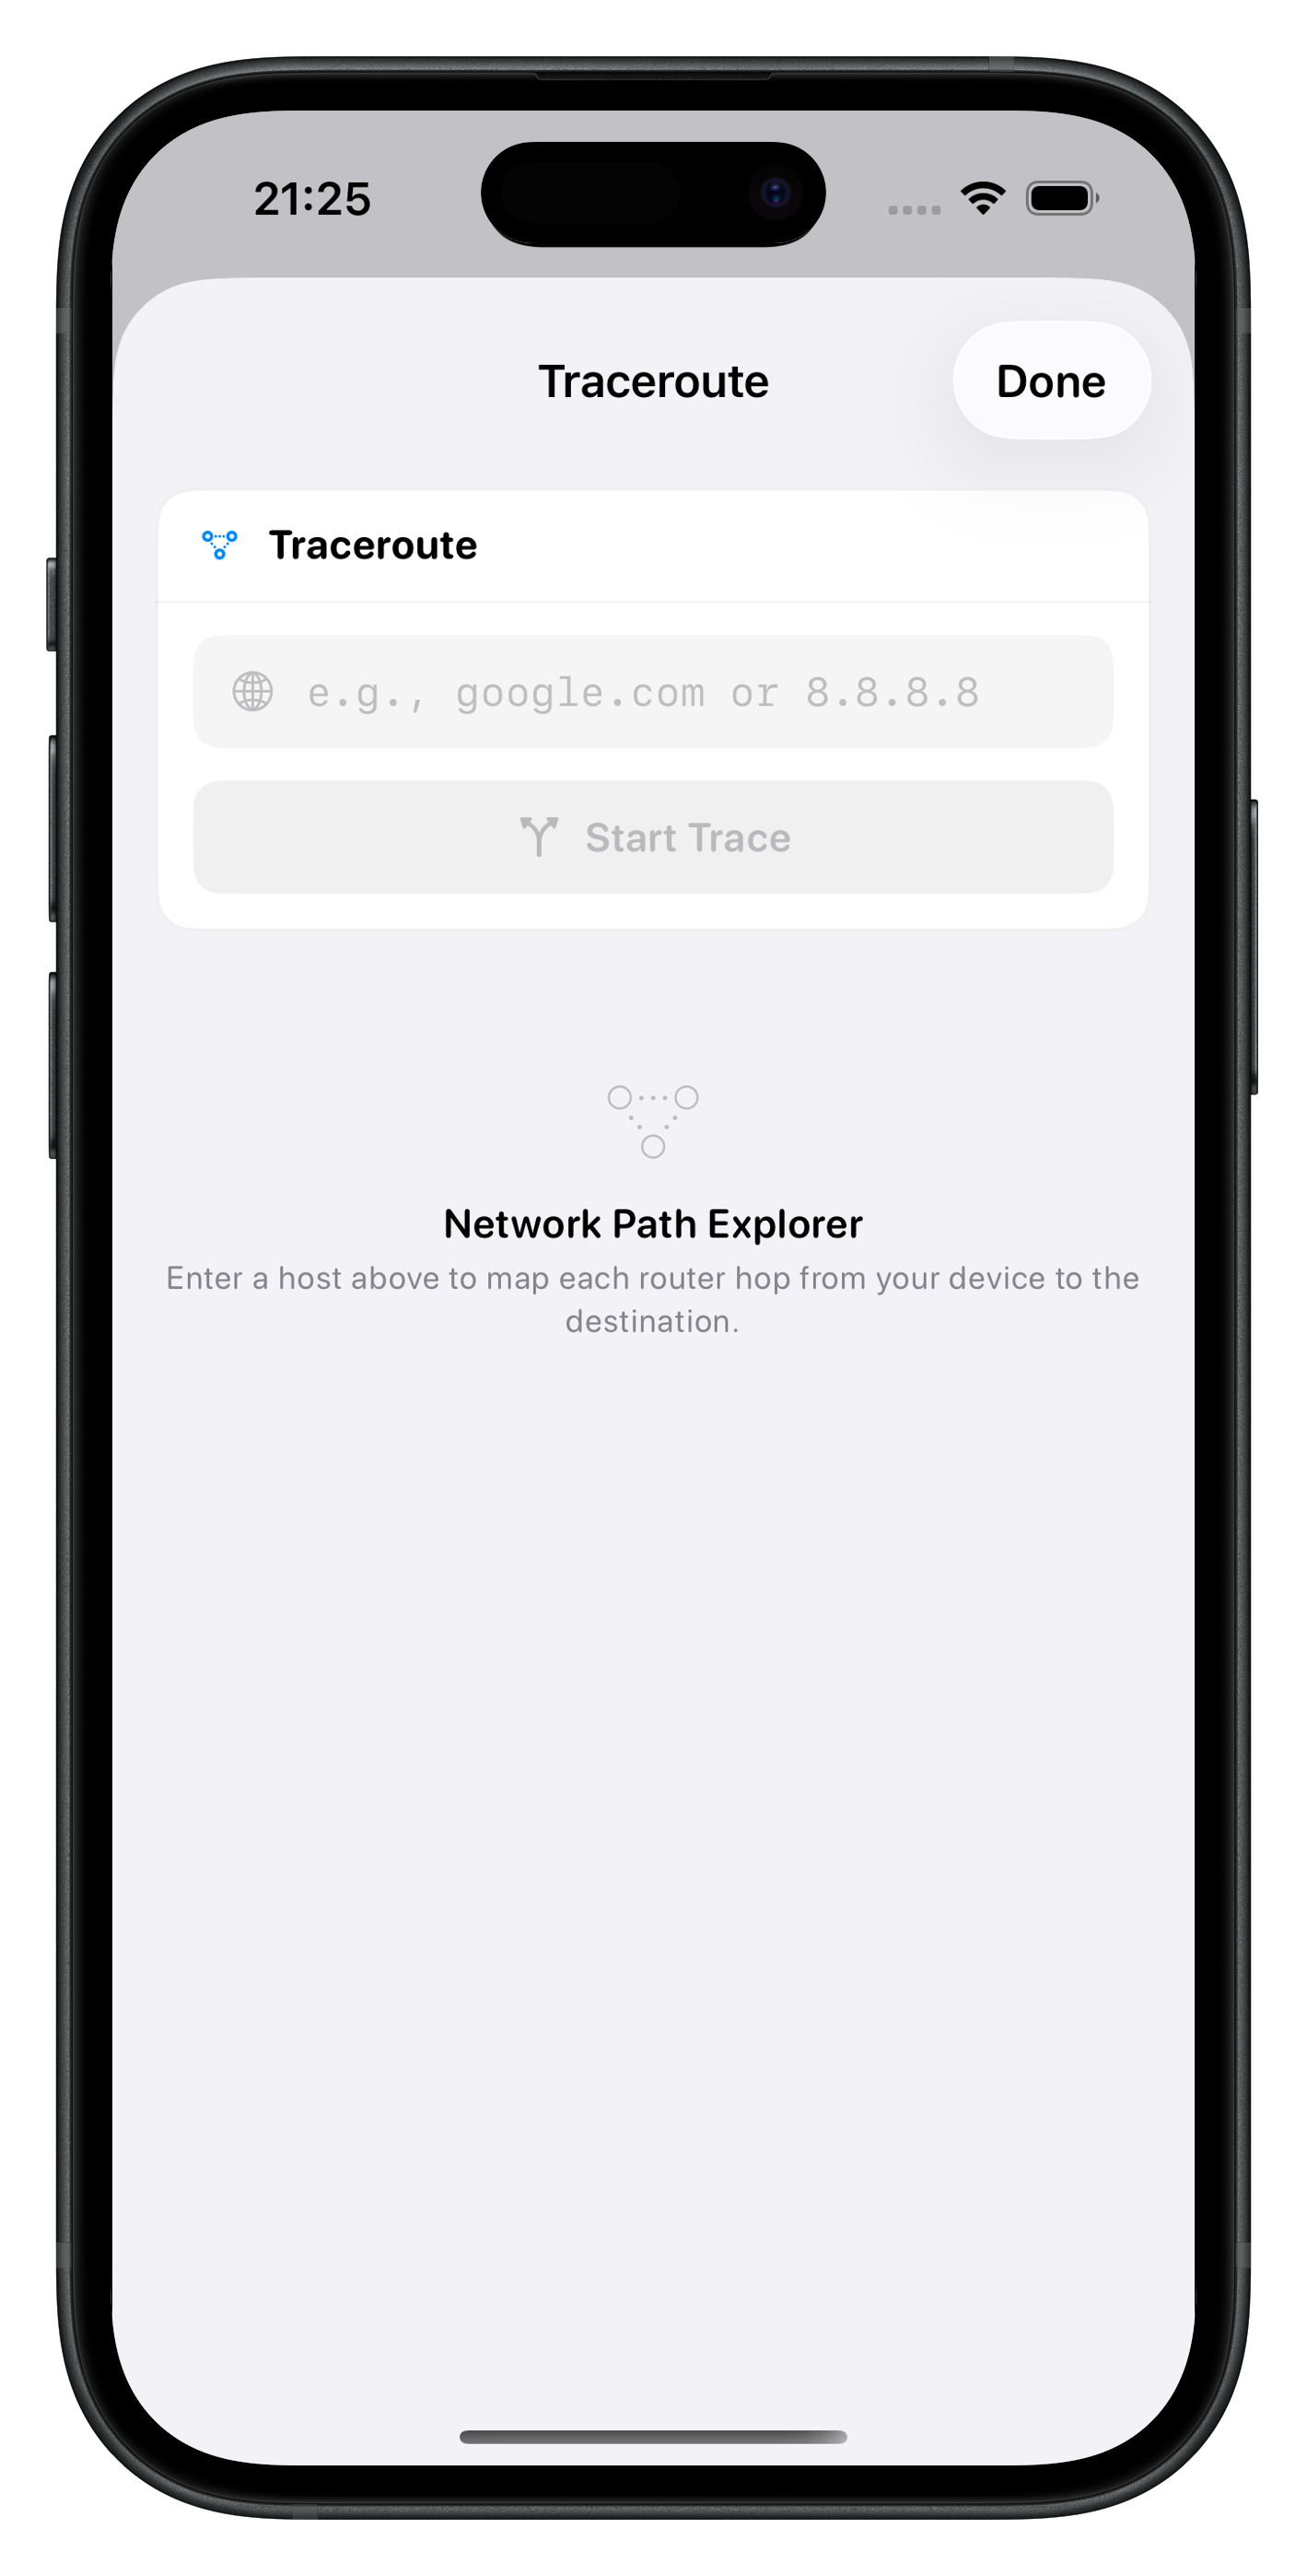
Traceroute
Map the full path your traffic takes from your device to any destination. Each hop is shown with its IP address, hostname (where available), response time, and geolocation on an interactive map. Ideal for diagnosing routing issues and identifying where latency originates.
Traceroute
Map each router hop from your device to the destination
TLS Inspector
Probe which TLS protocol versions and cipher suites a host supports. View handshake timing, certificate summary, and security findings in one place.
TLS Inspector
Protocol support, security grade, and certificate summary
Blacklist Check
Check domains and IP addresses against DNS blocklists (RBLs). Zone-aware policy, optional MX resolution, and a clear verdict for email and security triage.
Blacklist Check
Domain, URI, IP, and mail server blocklist verdict
Network Diagnostics
Run a full network health report for any host: ping, DNS, HTTPS, TLS, speed sample, and NAT classification with an overall score and phase checklist.
Network Diagnostics
Multi-phase health report with optional traceroute
Bonjour Browser
Browse mDNS/DNS-SD services on your local network. Resolve service details, TXT records, and Thread/Matter endpoints where available.
Bonjour Browser
Continuous mDNS browse with service type filters
LAN Scanner
Discover devices on your local subnet with phased discovery, optional custom CIDR, HTTP banner hints, Wake-on-LAN, network map, and CVE lookup.
LAN Scanner
Phased discovery with list and network map views
NAT / STUN Probe
Detect NAT type and public endpoint using RFC 5780 STUN behaviour mapping, with IPv6 support and round-trip timing.
NAT / STUN Probe
External address, NAT type, and STUN round-trip times
DNS Propagation
Check how a DNS record resolves across multiple public resolvers worldwide and compare consensus with your device resolver.
DNS Propagation
Global resolver comparison with TTL and consensus
System Tools
Hardware diagnostics, PDF utilities, image tools, and developer encoding.
System Tools provides 11 privacy-first utilities across Hardware, Developer, Image, and PDF categories. Everything runs entirely on-device. No files are uploaded to any server. Requires Pro Pack or an active free trial.
System Tools
Hardware diagnostics, developer, image, and PDF utilities
✓ Display Test
✓ Touch Grid
✓ Haptic Test
✓ Audio Check
✓ Sensor Lab
✓ System Snapshot
✓ Encoder / Hash
✓ Image Converter
✓ EXIF Stripper
✓ Photo Tagger
✓ PDF Unlocker
✓ PDF Metadata
Hardware Diagnostics
Six interactive device checks help you validate display pixels, touch coverage, haptics, microphone and speaker response, motion sensors, and a live sysctl-backed system snapshot you can share.
Display Test
Solid colour fills for dead pixel checks
Touch Grid
Full screen touch coverage test
Haptic Test
Impact, notification, and selection patterns
Audio Check
Microphone level and speaker test tone
Sensor Lab
Motion, magnetometer, and barometer charts
System Snapshot
One tap live metrics capture and share
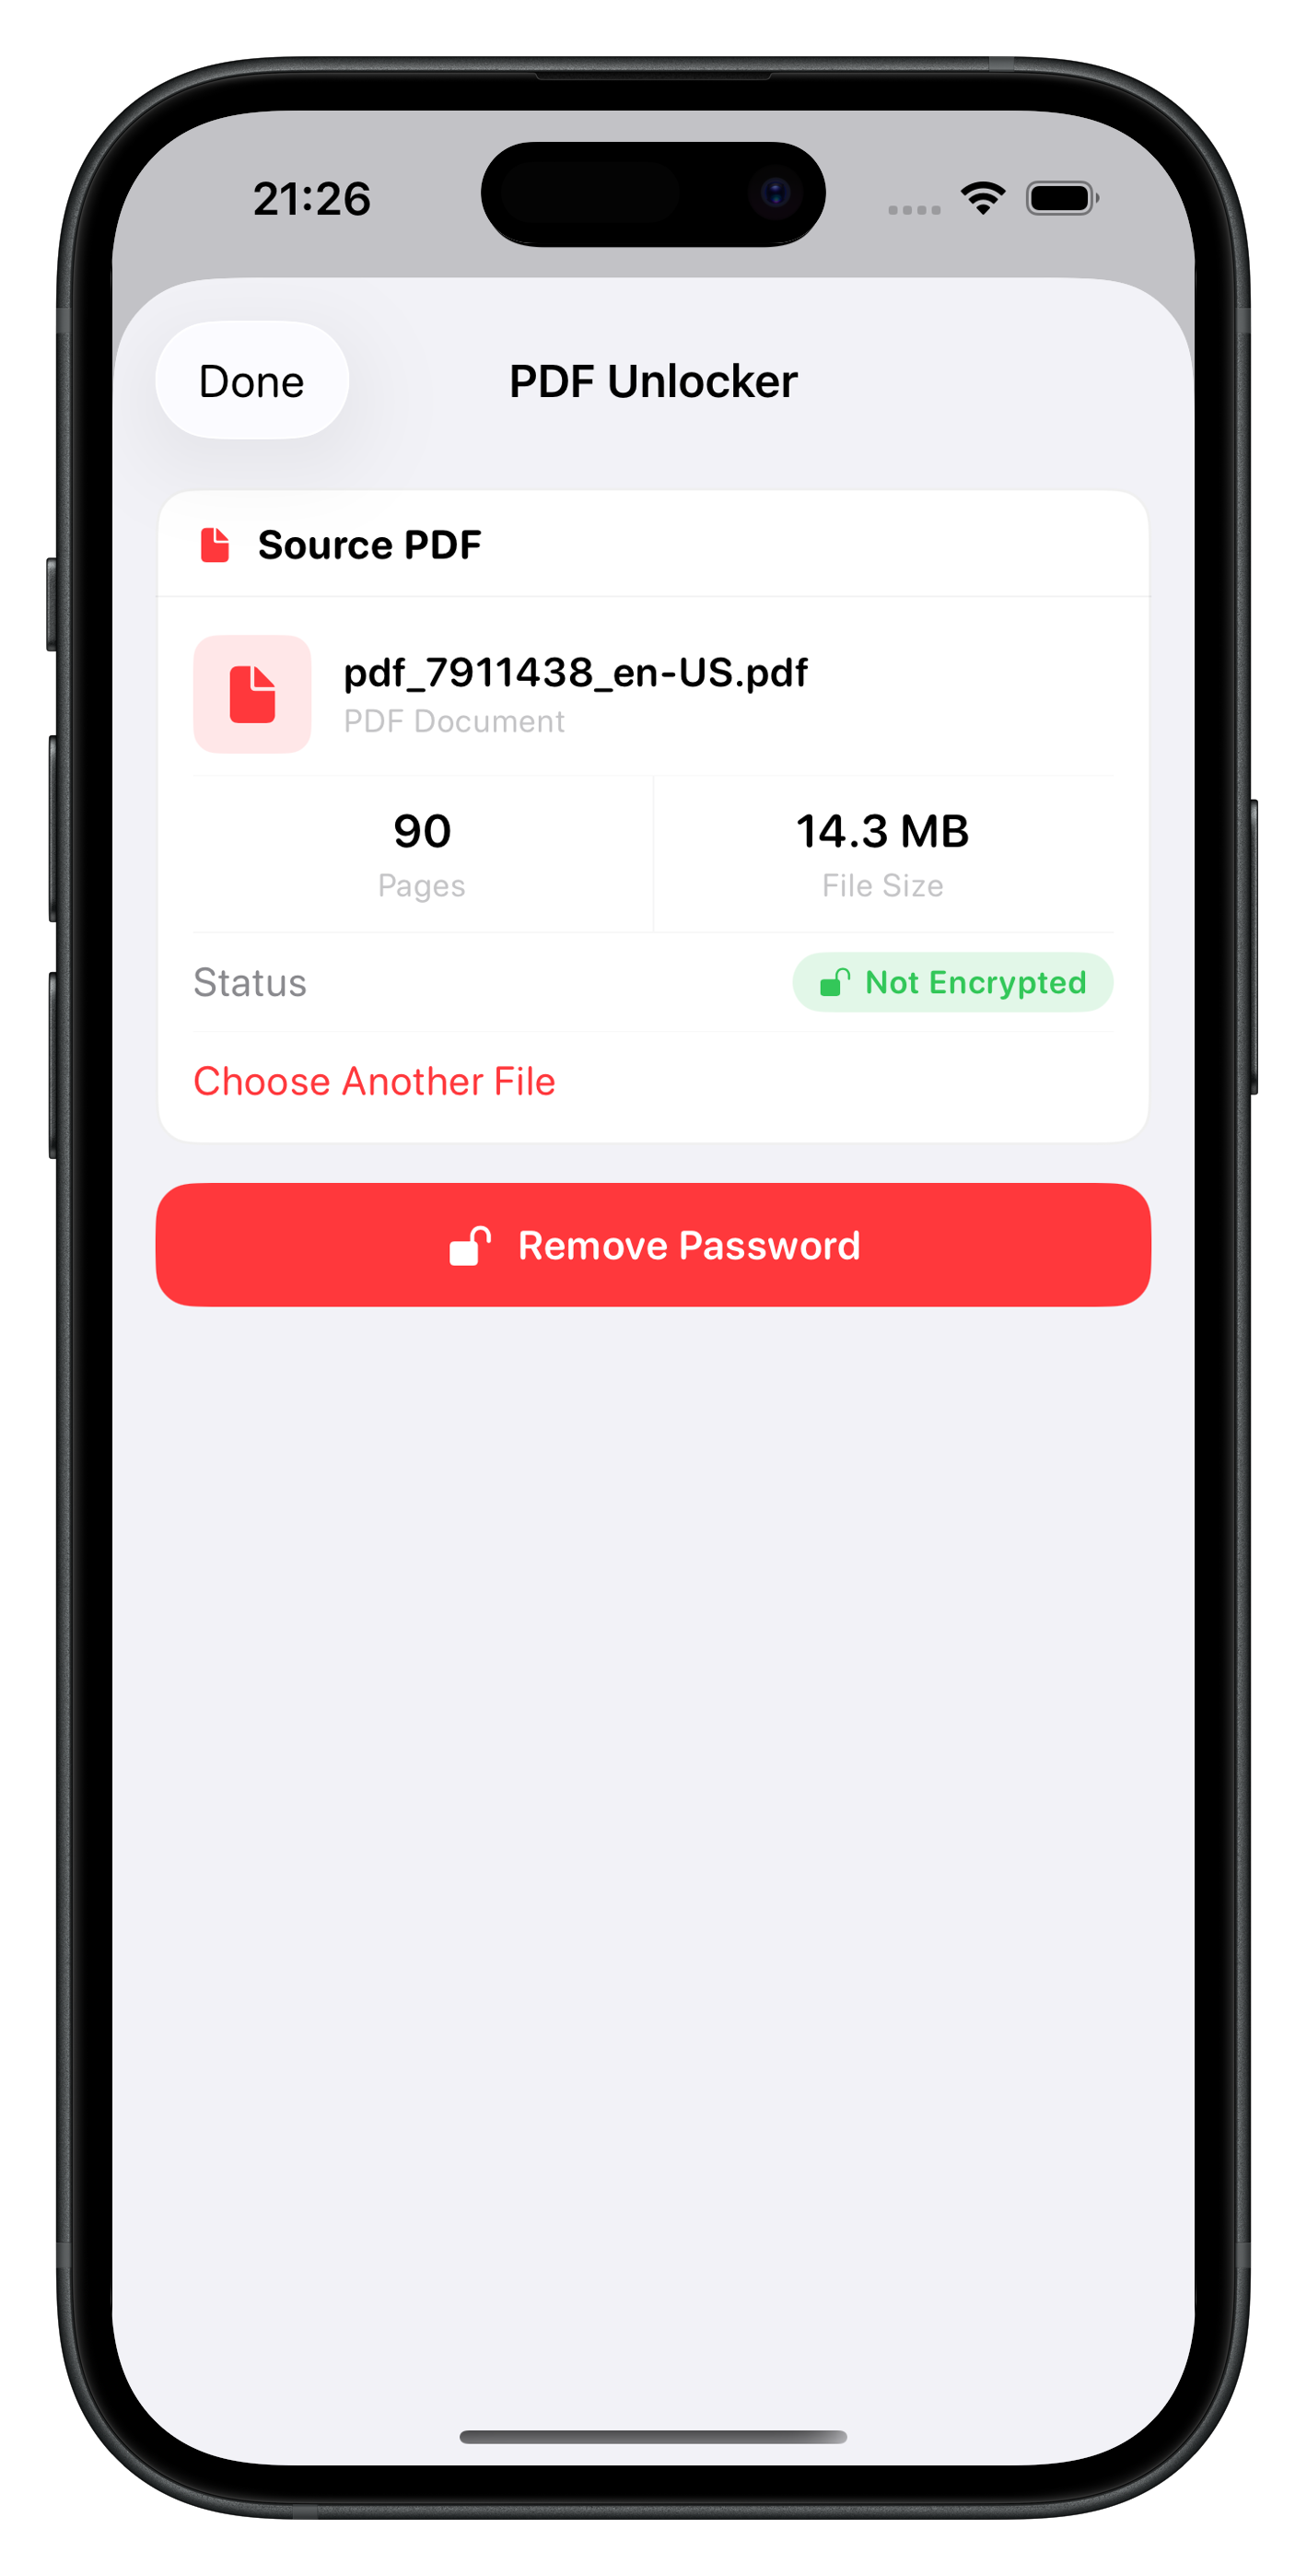
PDF Unlocker
Remove password protection from PDF files you own. Select a PDF from Files, check its encryption status, and tap Remove Password to save a clean, unlocked copy back to your device.
PDF Unlocker
Remove password protection from your PDFs on-device
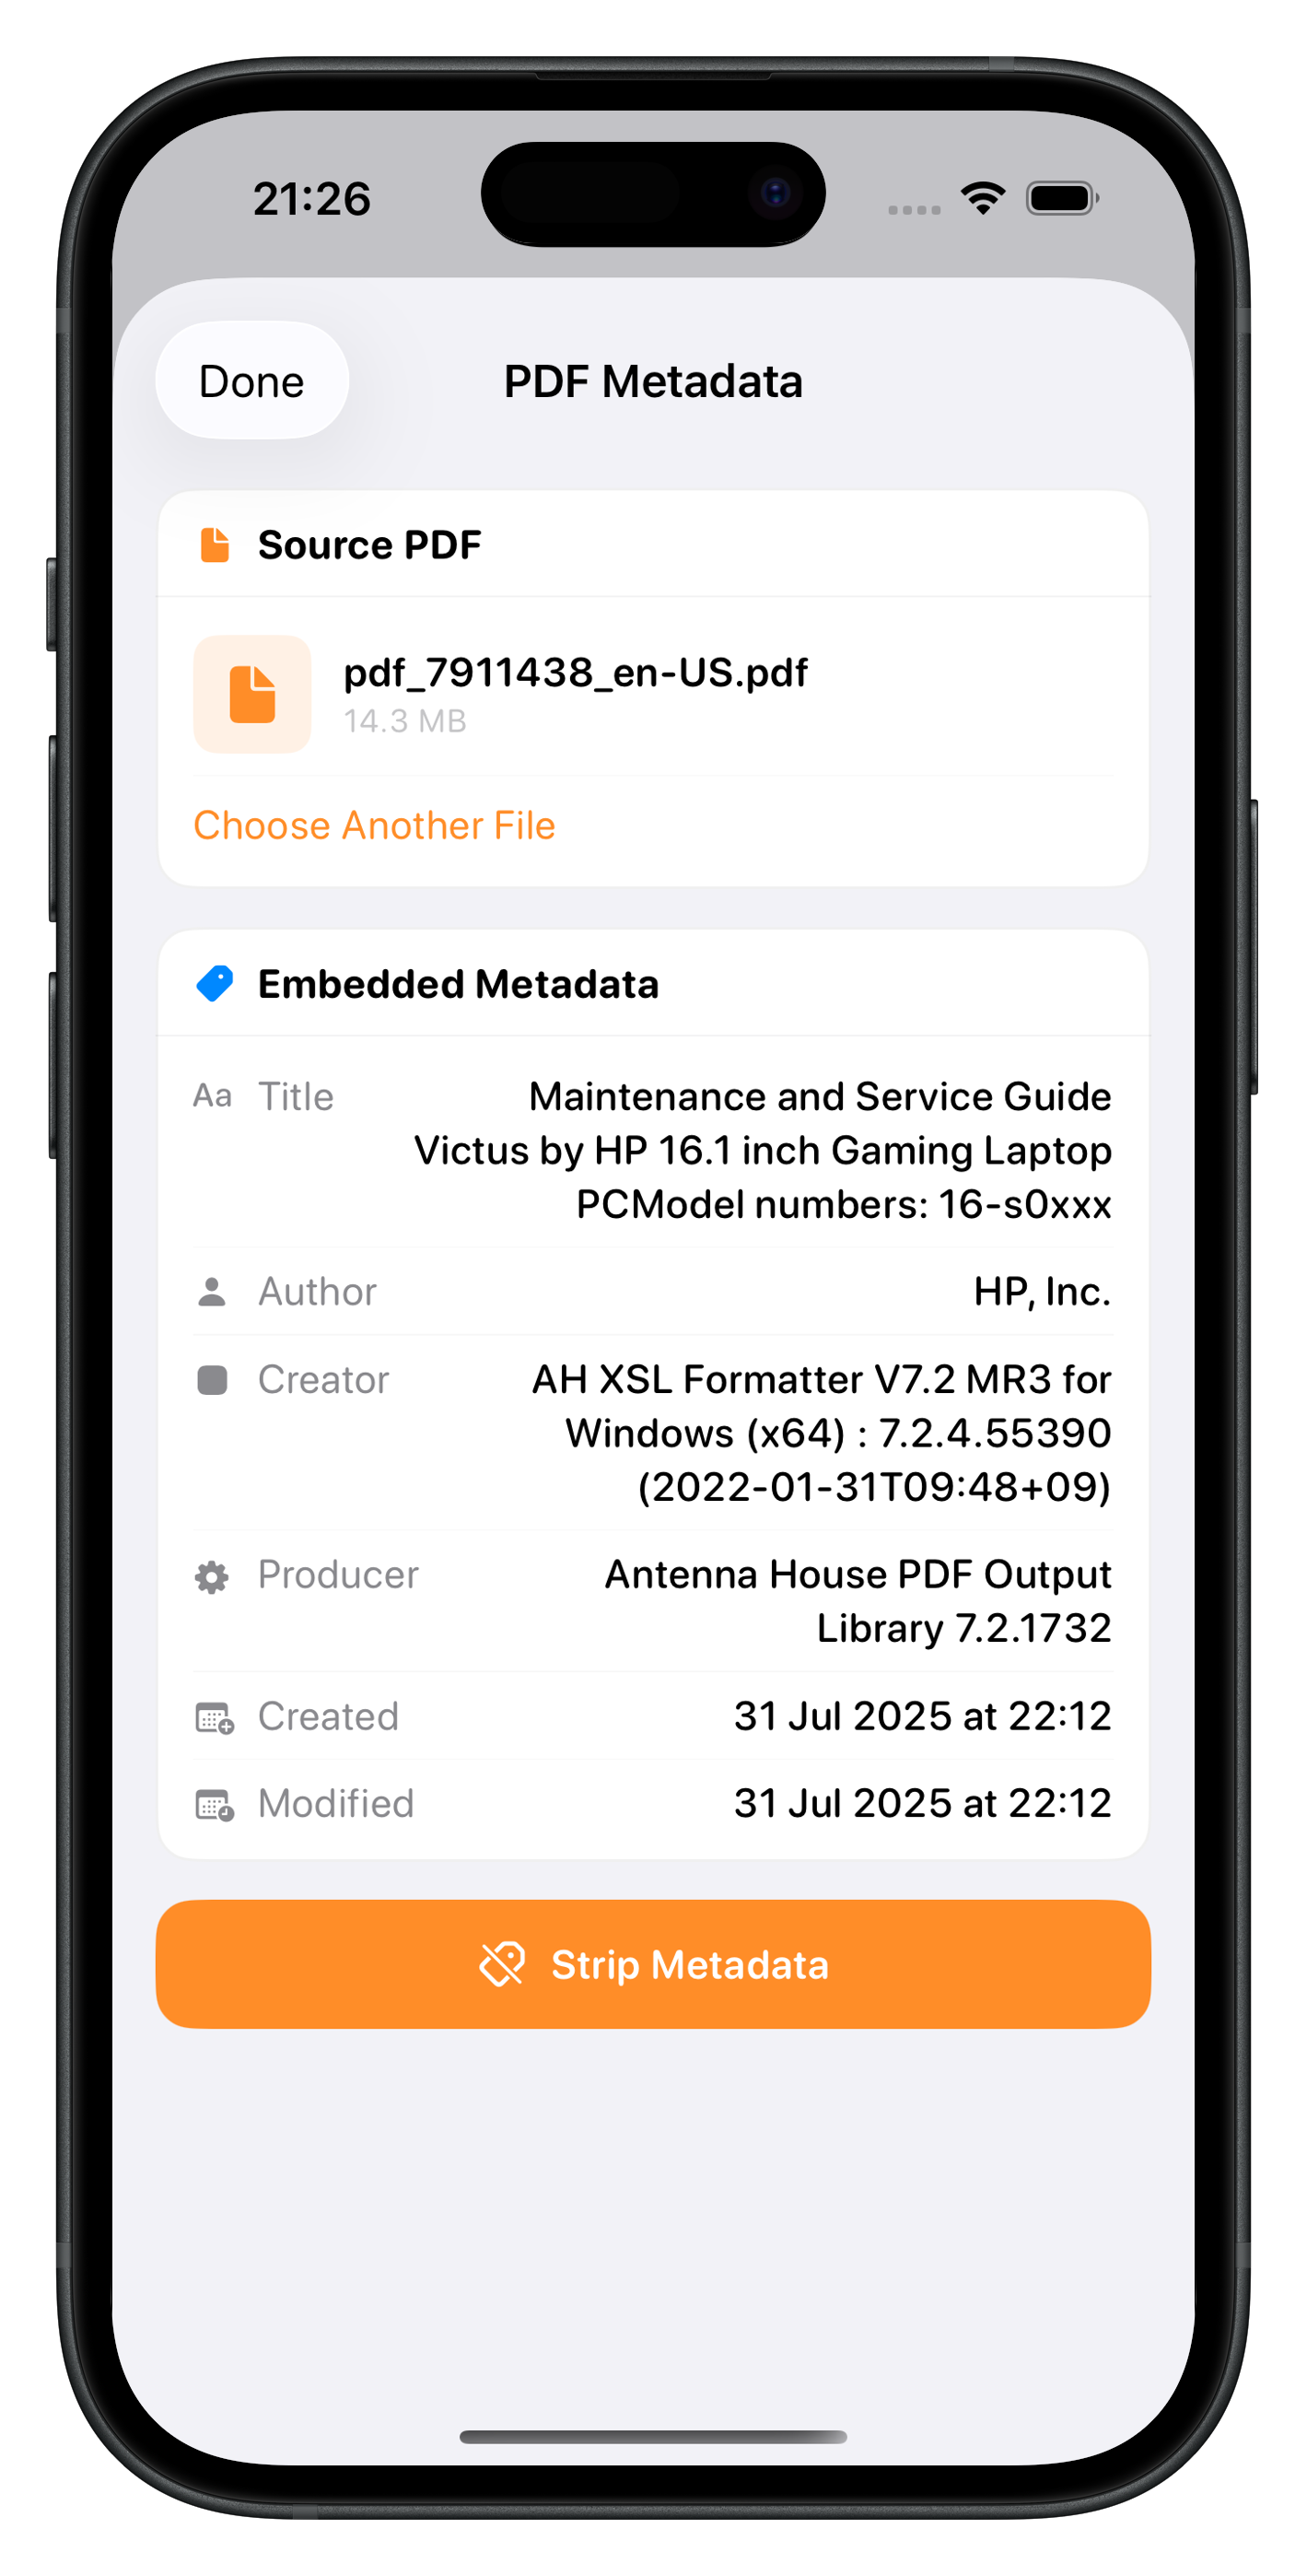
PDF Metadata Editor
View and strip embedded metadata (Title, Author, Creator, Producer, creation and modification dates) from any PDF. One tap exports a clean PDF with all metadata removed.
PDF Metadata Editor
Inspect and remove embedded metadata before sharing
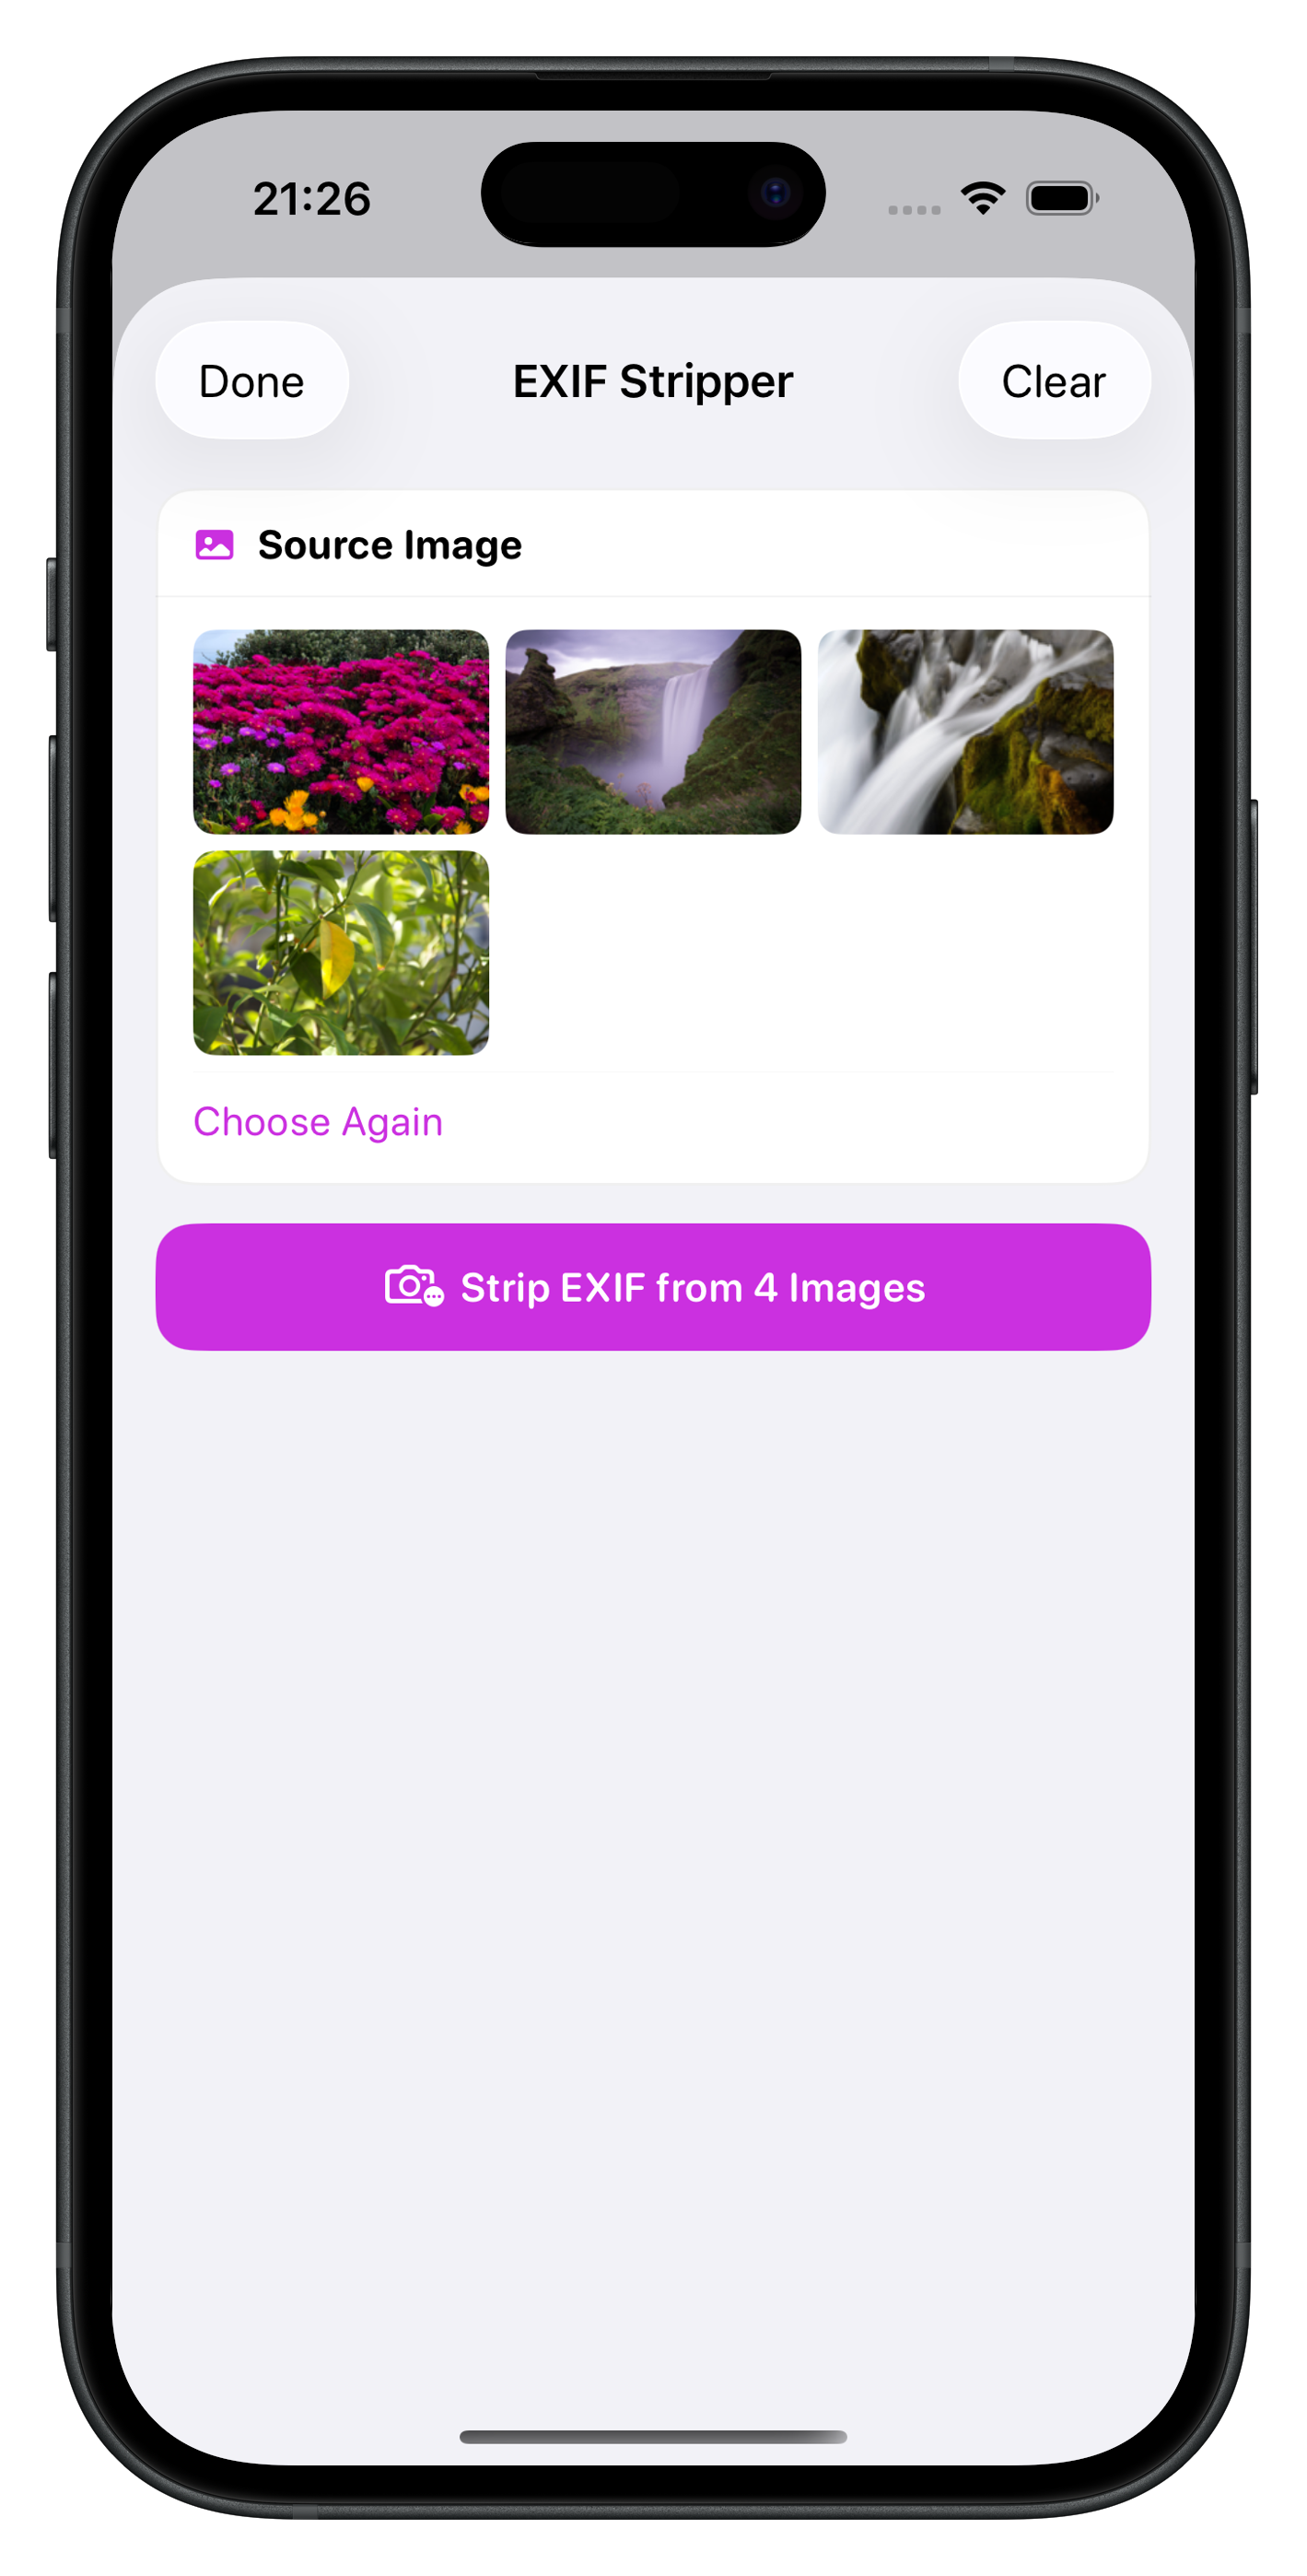
EXIF Stripper
Batch-remove EXIF metadata (GPS location, camera model, timestamps, and more) from photos before sharing them. Select multiple images from your library and strip all metadata in one tap.
EXIF Stripper
Batch-strip GPS and camera metadata from photos
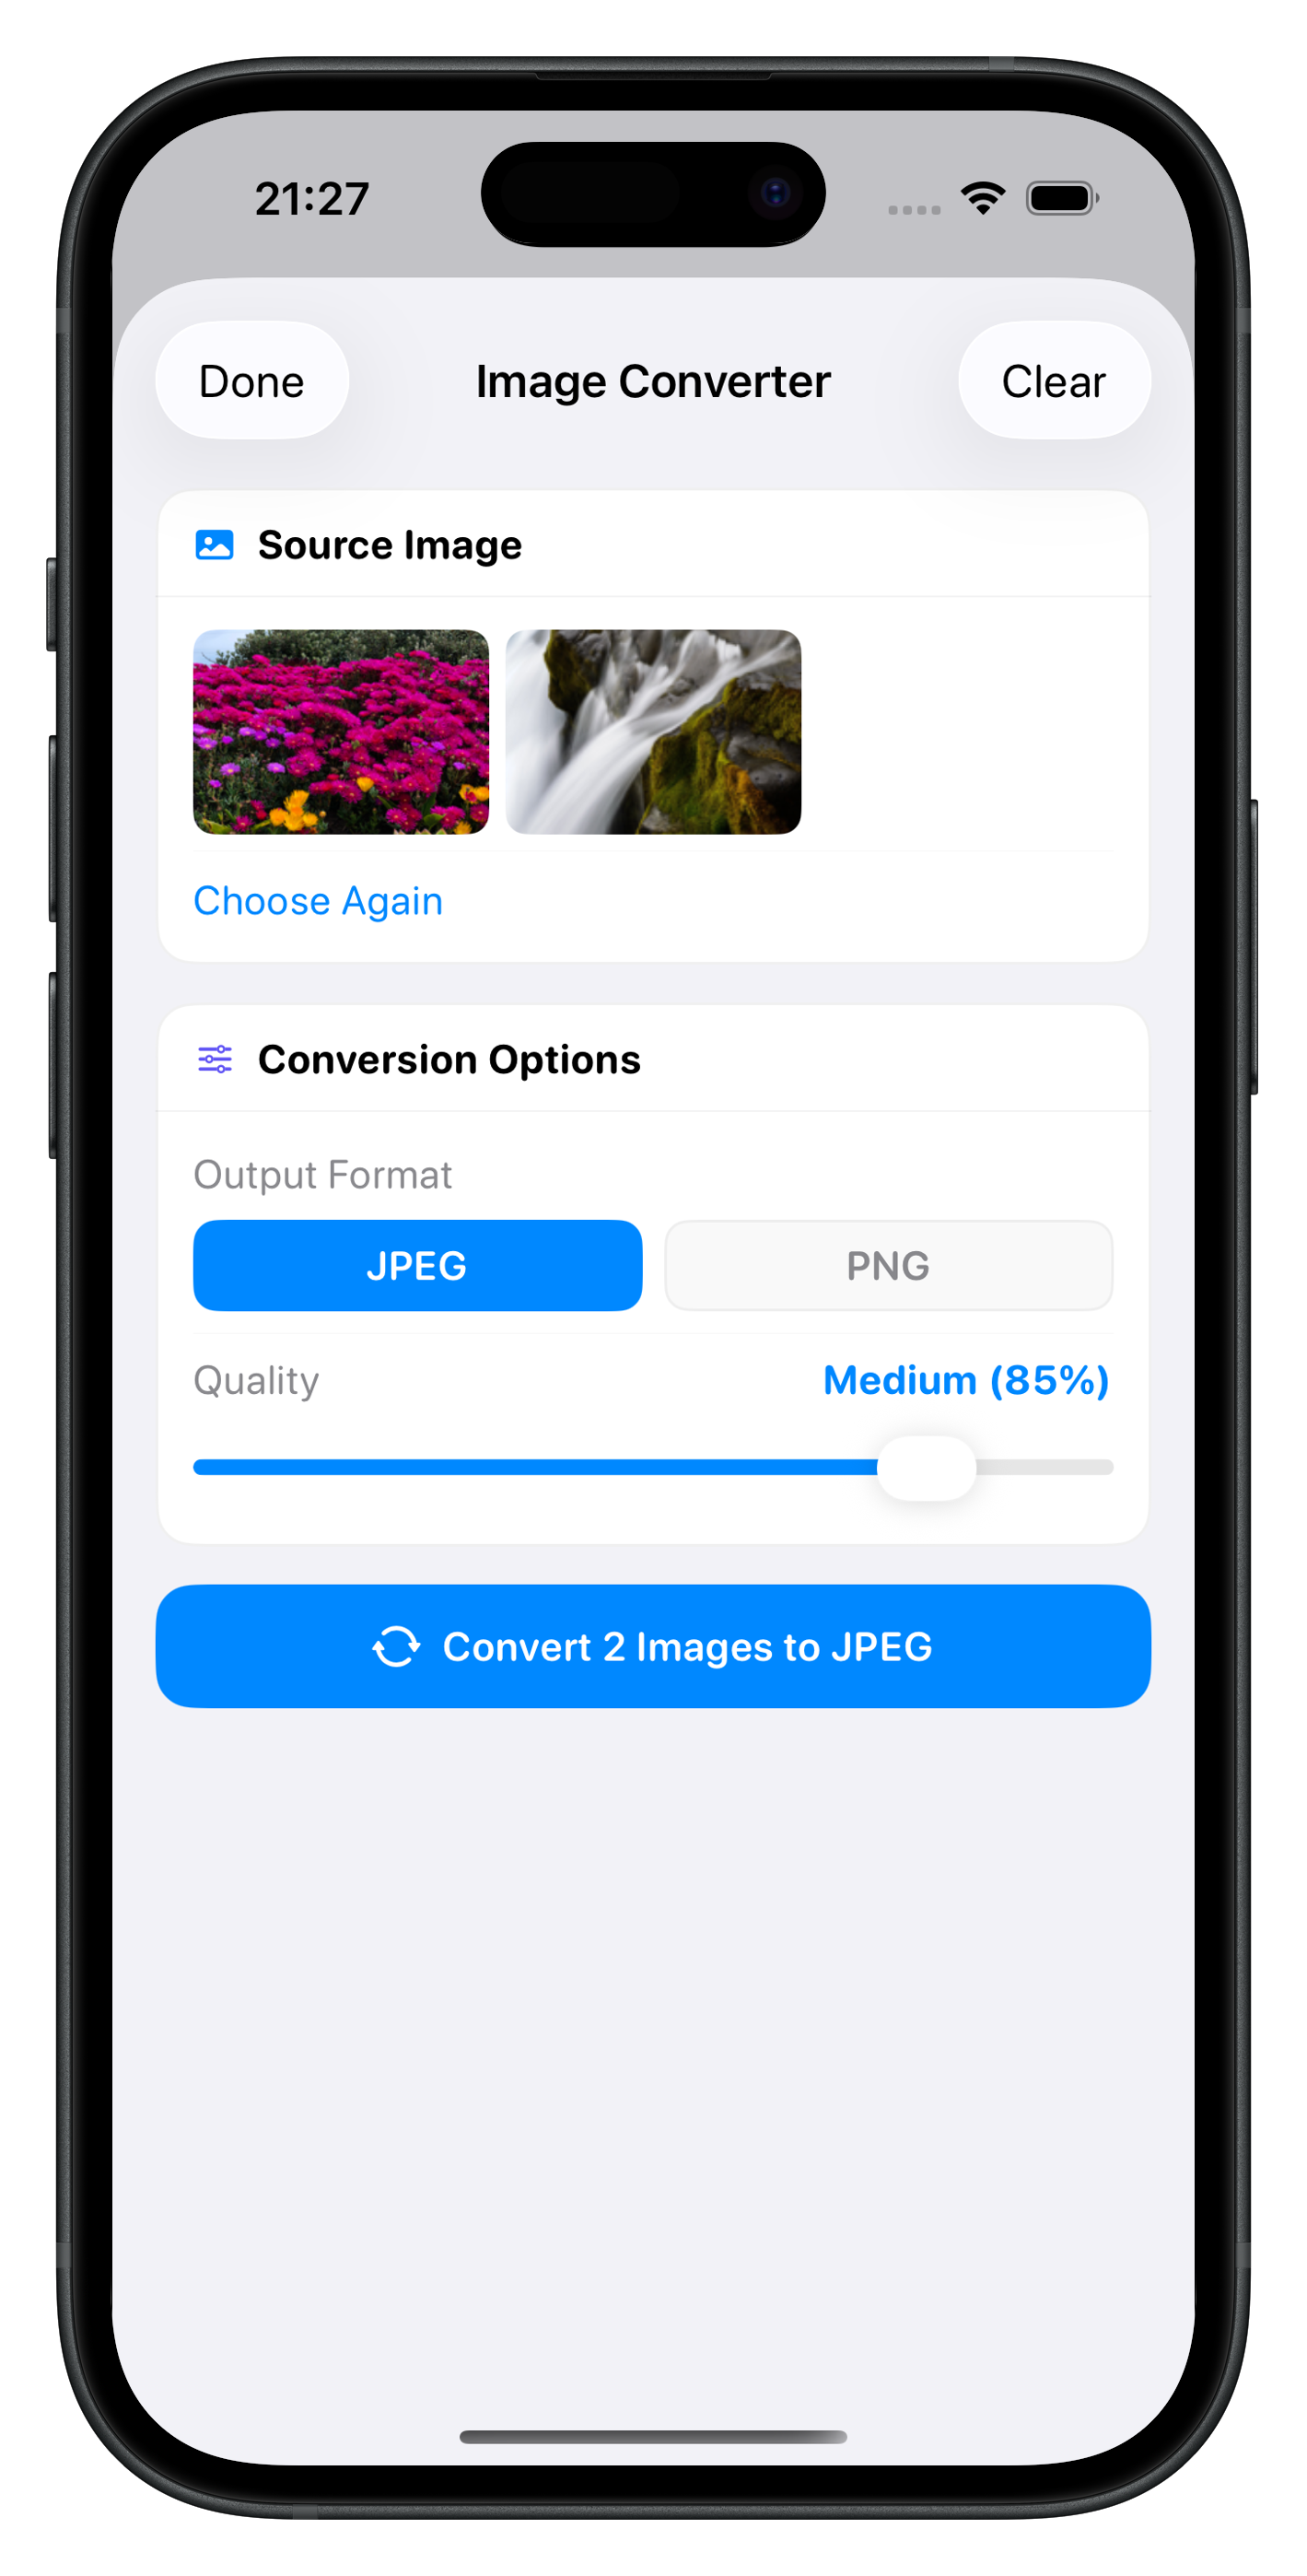
Image Converter
Convert images between JPEG and PNG formats. Control output quality with a live slider (Low, Medium, High). Batch convert multiple images at once and save the results directly to your Photos library.
Image Converter
Convert and compress images with adjustable quality
Photo Tagger
Add date, time, and GPS location metadata to photos before export. Supports single images and batch mode with a map-based location picker.
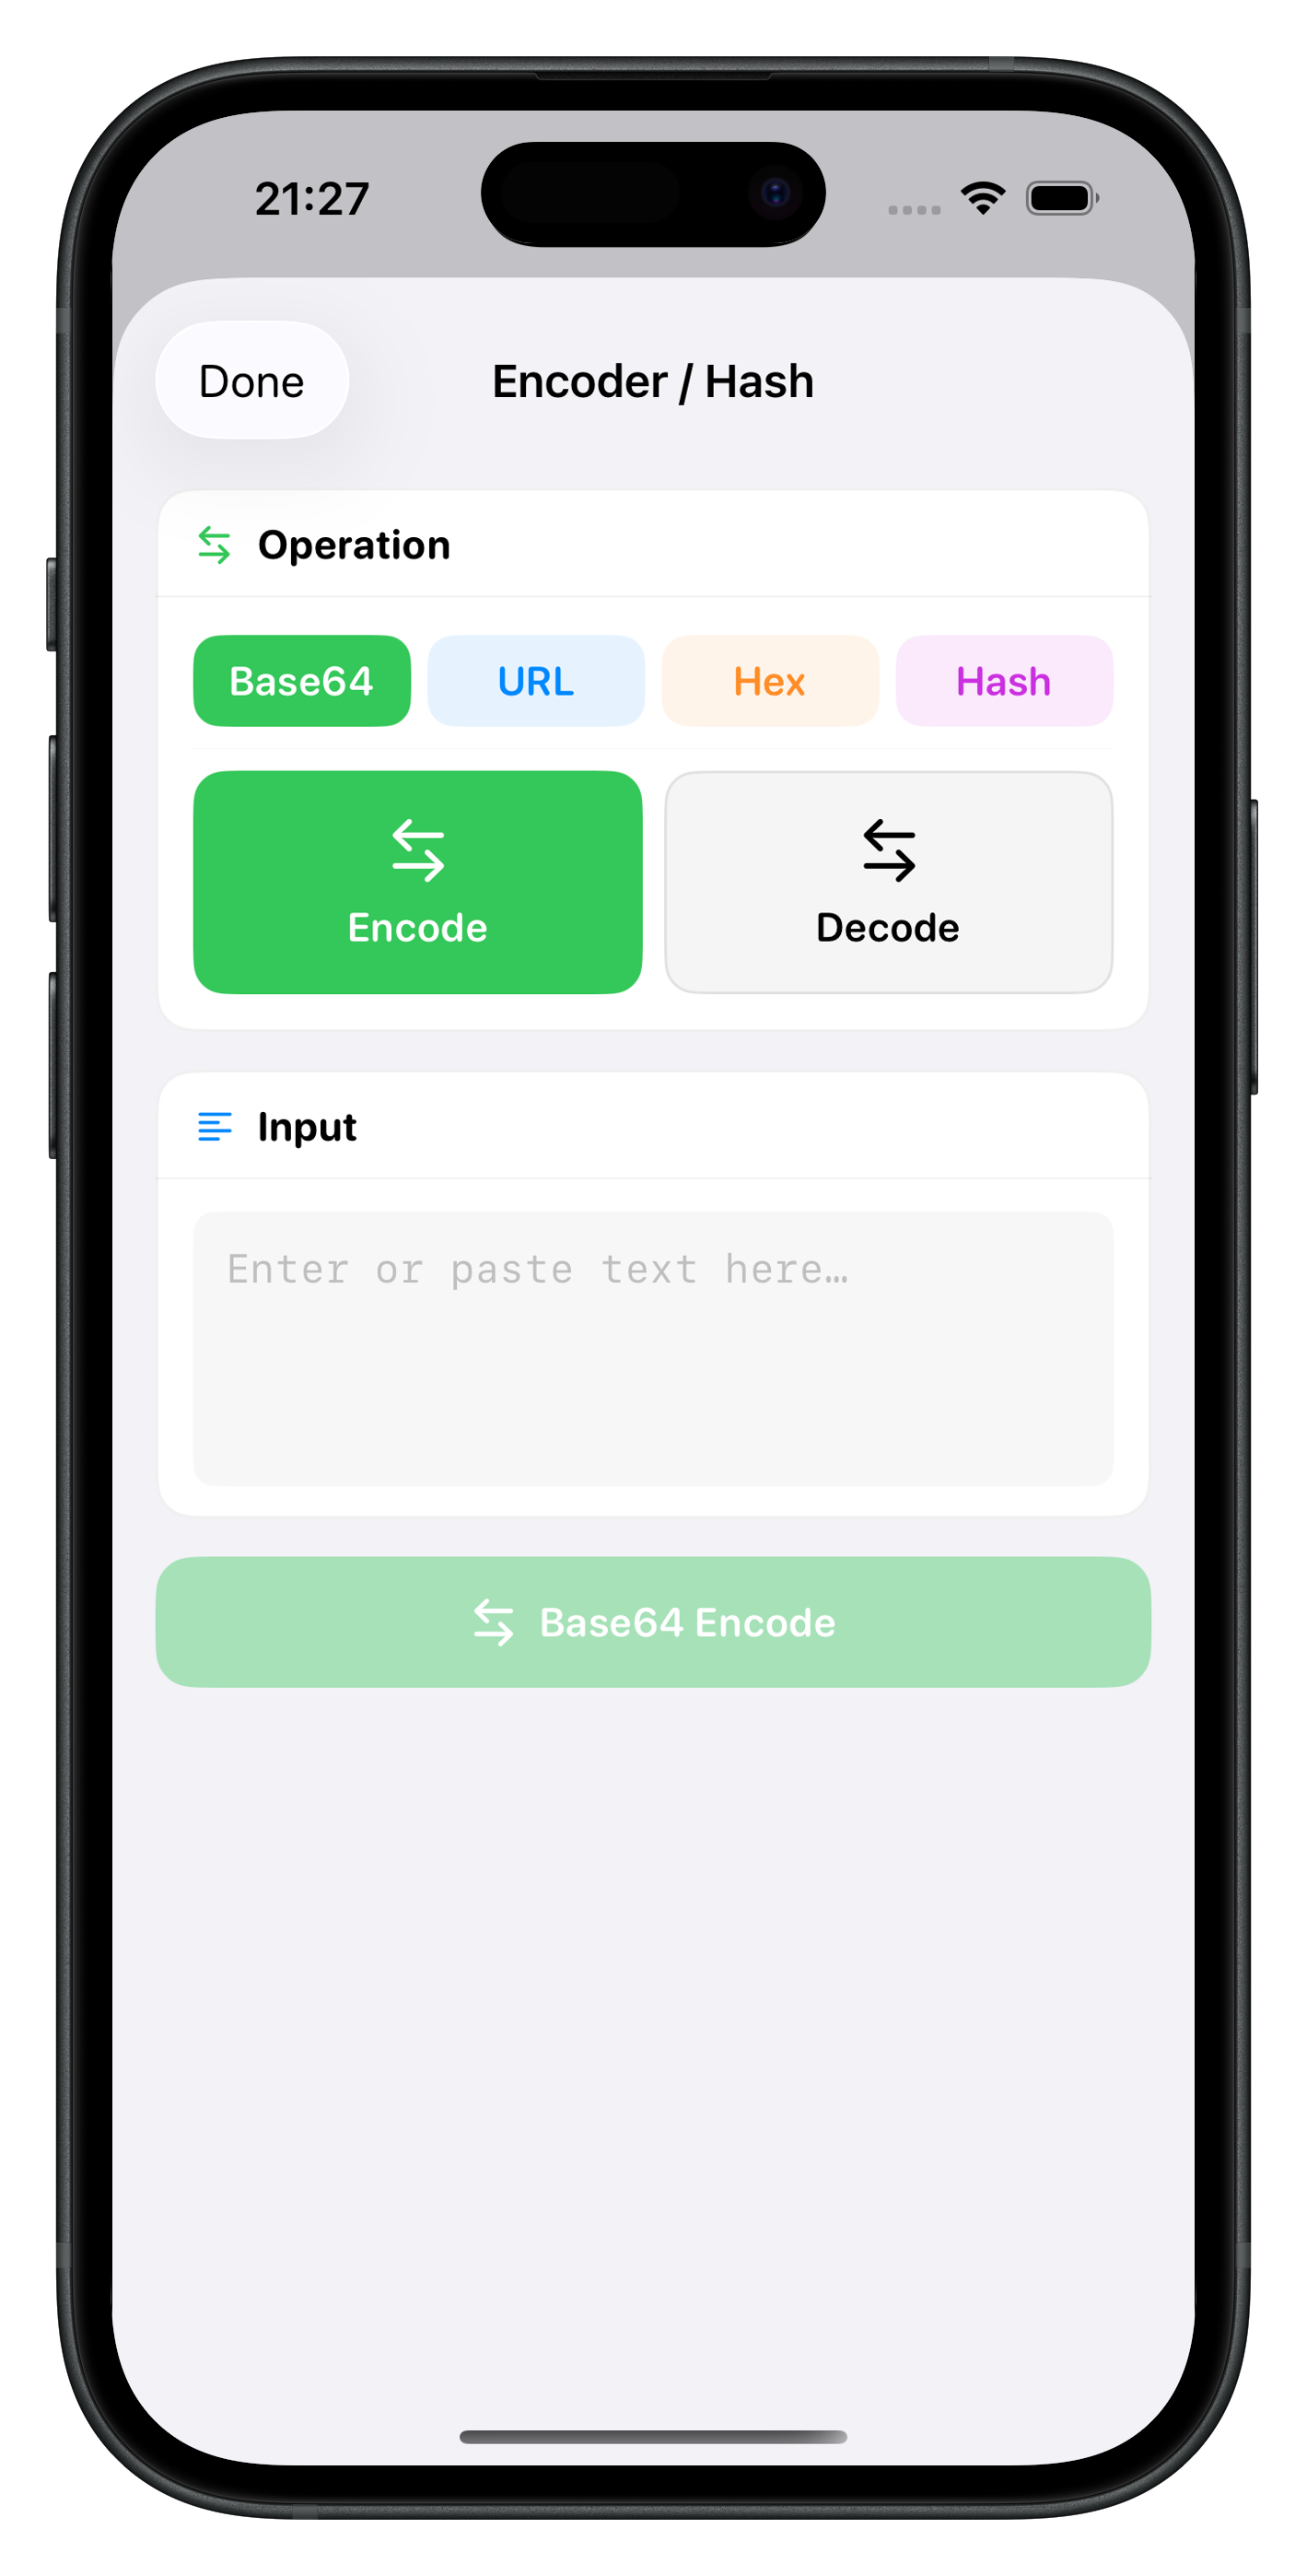
Encoder / Hash
Encode and decode text using Base64, URL encoding, or Hex. Generate cryptographic hashes (MD5, SHA-1, SHA-256, SHA-512), HMAC, and decode JWT payloads. Results are copyable with one tap.
Encoder / Hash
Base64, URL, Hex, hashes, HMAC, and JWT decode
Settings & Customization
Tailor StatBoard to your preferences.
The Settings screen provides access to appearance, data collection, alerts, and account management options.
Settings
App preferences and management
Data Collection
Refresh rate and data retention
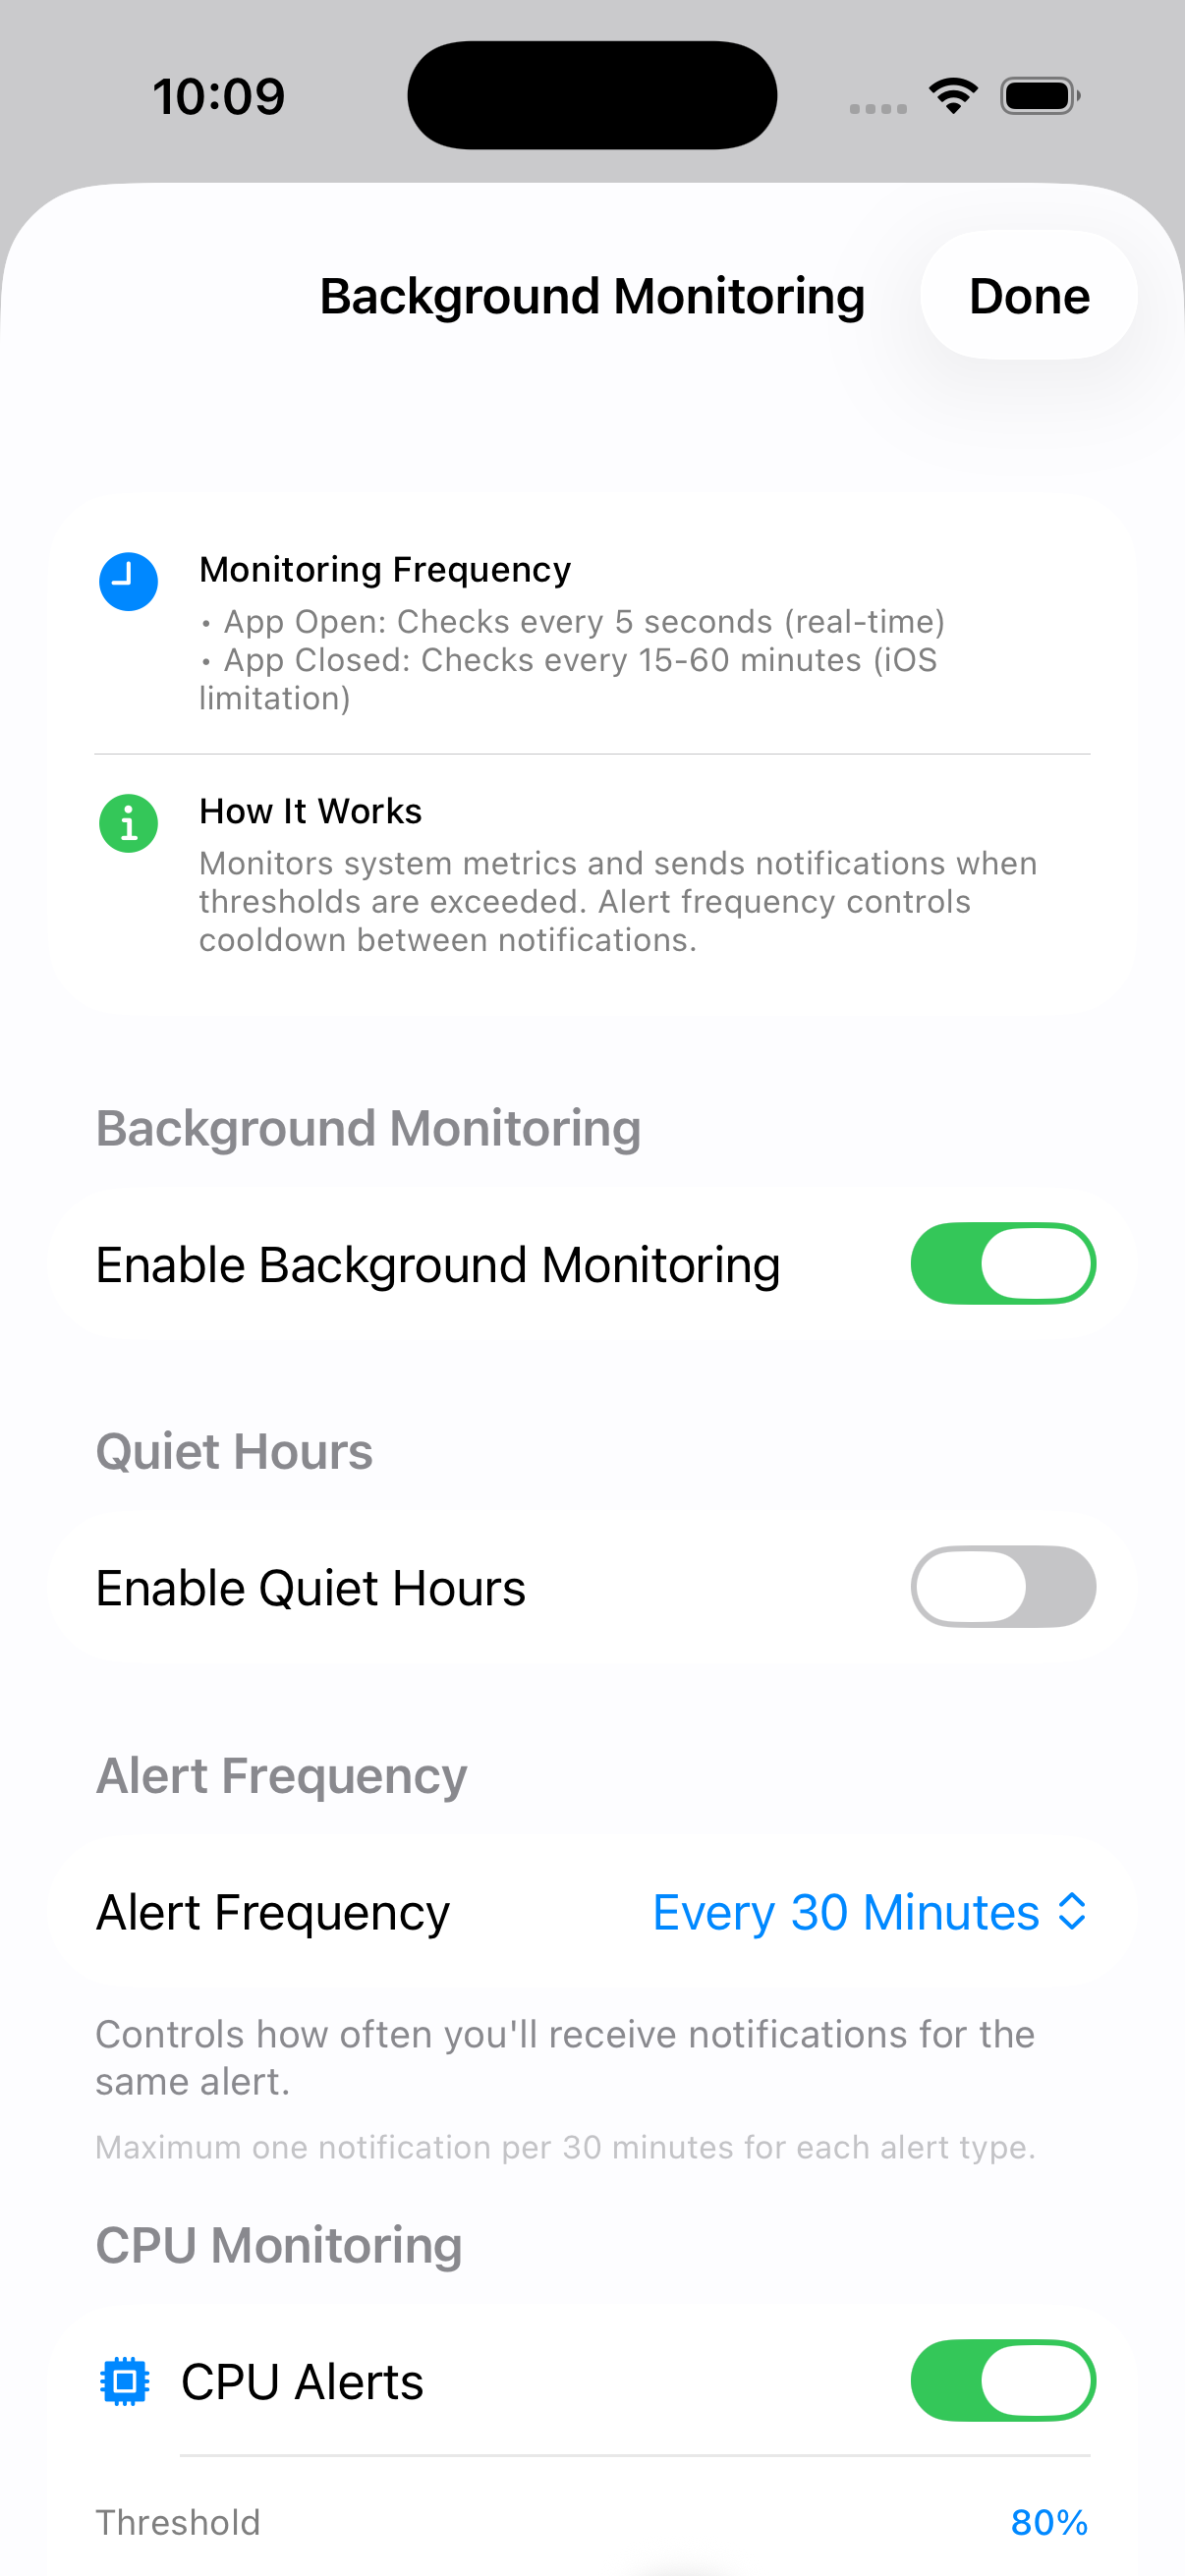
Alerts & Notifications
Background monitoring, thresholds, and quiet hours
🎨
Appearance
Choose between Light, Dark, or Auto theme. Dark mode is OLED-optimized with true black backgrounds.
📊
Data Collection
Set the refresh rate (1–10 seconds) and data retention period (1–30 days) for historical metrics.
🔔
Alerts & Notifications
Enable background monitoring with custom thresholds for CPU, memory, battery, and storage. Set quiet hours and alert frequency.
🗑️
Clear History
Delete all historical metric data at any time. Reset all settings to restore default preferences.
Pricing & In-App Purchases
StatBoard is free to download with a 7-day trial of all Pro features. No subscriptions.
Feature
Free
Pro Pack
Dashboard & Metrics
✓
✓
CPU, Memory, Battery, Storage
✓
✓
Network Monitoring
✓
✓
Device Information
✓
✓
Network Tools (16 tools)
-
✓
System Tools (hardware, PDF, image, dev)
-
✓
AI Insights & Intelligence
-
✓
Background Monitoring
-
✓
Price
Free
$4.99
The Pro Pack is a one-time purchase - no subscriptions, no recurring fees. It includes a 7-day free trial so you can try all features before buying.
Need Help?
If you have questions, feedback, or need support, you can reach the developer: