MagTicker · Swing Trading Guide
How to Swing Trade with MagTicker
A practical guide to finding multi-day setups on MAG-7 stocks: reading the dashboard, confirming in Analysis, planning your entry, stop, and take-profit levels, and staying aligned across the trading week.
🔔
Stay alert
Notifications
Before You Start
MagTicker is a decision-support tool for swing traders. It is not a broker and not financial advice.
The app analyses your watchlist using daily OHLCV candles and shows you a directional bias (Long, Short, or Neutral), a setup status (how close price is to the ideal entry), and a risk plan (entry, stop loss, and three take-profit levels sized to your risk). These signals are designed for multi-day to multi-week swing trades, not intraday scalping. You decide whether to act.
Important: MagTicker does not place trades. All strategy levels are derived from daily-close analysis. Use your own judgement, position sizing, and broker to execute. See the full
Disclaimer.
📱
What the app gives you
Directional bias, entry zone, stop loss, TP1-TP3, star rating, and a full indicator context panel. Updated at each of the five daily market anchors or on manual refresh.
🚫
What it does not do
No order execution, no broker connection, no personalised advice. The 1H chart is for visual context only. All strategy levels are computed on daily candles.
Why MagTicker Suits Swing Trading
Every design decision in the app targets the multi-day hold: daily timeframe, EMA structure entries, ATR-sized risk, and anchor-based monitoring.
📅
Daily candles for signal quality
All EMA, ADX, RSI, MACD, and Fibonacci calculations run on daily bars. Daily signals filter out intraday noise and identify setups that can run for days or weeks before reaching TP levels.
📏
Structural entry zones
The entry level marks a structural support (Long) or resistance (Short) zone derived from a blend of daily indicators: classic swing pullback and bounce zones where institutional orders tend to cluster.
🎯
Volatility-sized R:R targets
The stop loss is sized to the symbol's recent daily volatility so routine fluctuations do not stop you out prematurely. TP1, TP2, and TP3 are fixed multiples of the risk taken (R-multiples), so the reward potential always scales with the risk.
🔔
Scheduled anchor monitoring
Five daily notifications keep you aligned without screen-watching. Pre-Market sets the directional plan; Open confirms it; Mid-Session and Close let you review active positions; the Friday weekly wrap gives broader perspective.
⚡
Momentum-gated signals
Momentum must support the trend before a Long or Short fires. Signals are suppressed when momentum opposes the trend structure, avoiding entries into late-stage moves that would produce adverse exits immediately.
🔁
Recovery detection
A dedicated recovery signal fires when price reclaims key structure with momentum confirming, even before the slower trend measures have fully realigned. Catches the first good entry in bounce and reversal setups that typical trend-following systems miss for several bars.
When trend strength is not yet confirmed at the time a recovery signal fires, the star rating is capped at 3★ — see Recovery signals and star ratings below.
Typical holding period: MagTicker setups are designed for trades that play out over 2 to 15 trading days. TP1 is usually reached within the first 2 to 5 days on a strong setup. TP2 and TP3 are runner targets — hold only when ADX is 30 or above and the EMA stack remains aligned with your direction. When ADX is below 30 or the EMA structure is mixed, take full profit at TP1 and wait for the next setup.
Swing Trading Workflow
Five to ten minutes at each anchor is enough to stay aligned. You are managing setups that may take days to reach their targets, not watching price minute by minute.
-
1
Open MagTicker at each anchor notification
Tap the Pre-Market, Open, Mid-Session, or Close notification to trigger a fresh analysis bounded to that anchor time. The app loads candle data as of that exact moment, not whenever you happen to open it. Levels are consistent with what the market showed at each key session point.
-
2
Check market context and any open positions
Review SPX, DJI, and NDQ at the top. A broadly bullish index supports existing longs and new long setups; bearish context suggests extra caution. If you track holdings, expand the Total Value card to see today's P&L and the original Stop Loss and Take Profit levels from your entry date.
-
3
Scan the HUD for actionable setups
Look for Long or Short bias with At Entry or Near Entry status and a star rating of 3 or above. Glance at Recent Alerts for symbols that just triggered an intraday condition such as Fibonacci proximity or an RSI extreme.
-
4
Confirm in Analysis before entering
Tap the symbol to open the full Analysis view. Confirm the chart supports the bias, check ADX (trend strength of 25 or above required for most signals), RSI, volume ratio, and review the exact Entry, SL, and TP1-TP3 levels from the risk matrix.
-
5
Write your swing plan and execute in your broker
Record Entry, SL, and TP levels. Size your position so the dollar distance from Entry to SL matches your per-trade risk budget. Place your order and take-profit alerts in your brokerage app. MagTicker does not send orders for you.
-
6
Monitor across sessions, not minute by minute
Once in a trade, check back at each anchor notification. At TP1, take 50% off and move stop to breakeven. Hold the remainder toward TP2 only if ADX is still 30 or above and the EMA stack is aligned with your direction. If ADX is below 30 or the EMA structure has become mixed, close the remainder at TP1 and book the full 1R gain. Treat TP2 and TP3 as bonus targets, not default expectations.
Reading the Dashboard
The Dashboard scrolls top to bottom: indices → portfolio → strategy HUD → recent alerts. Learn each section before you trade.
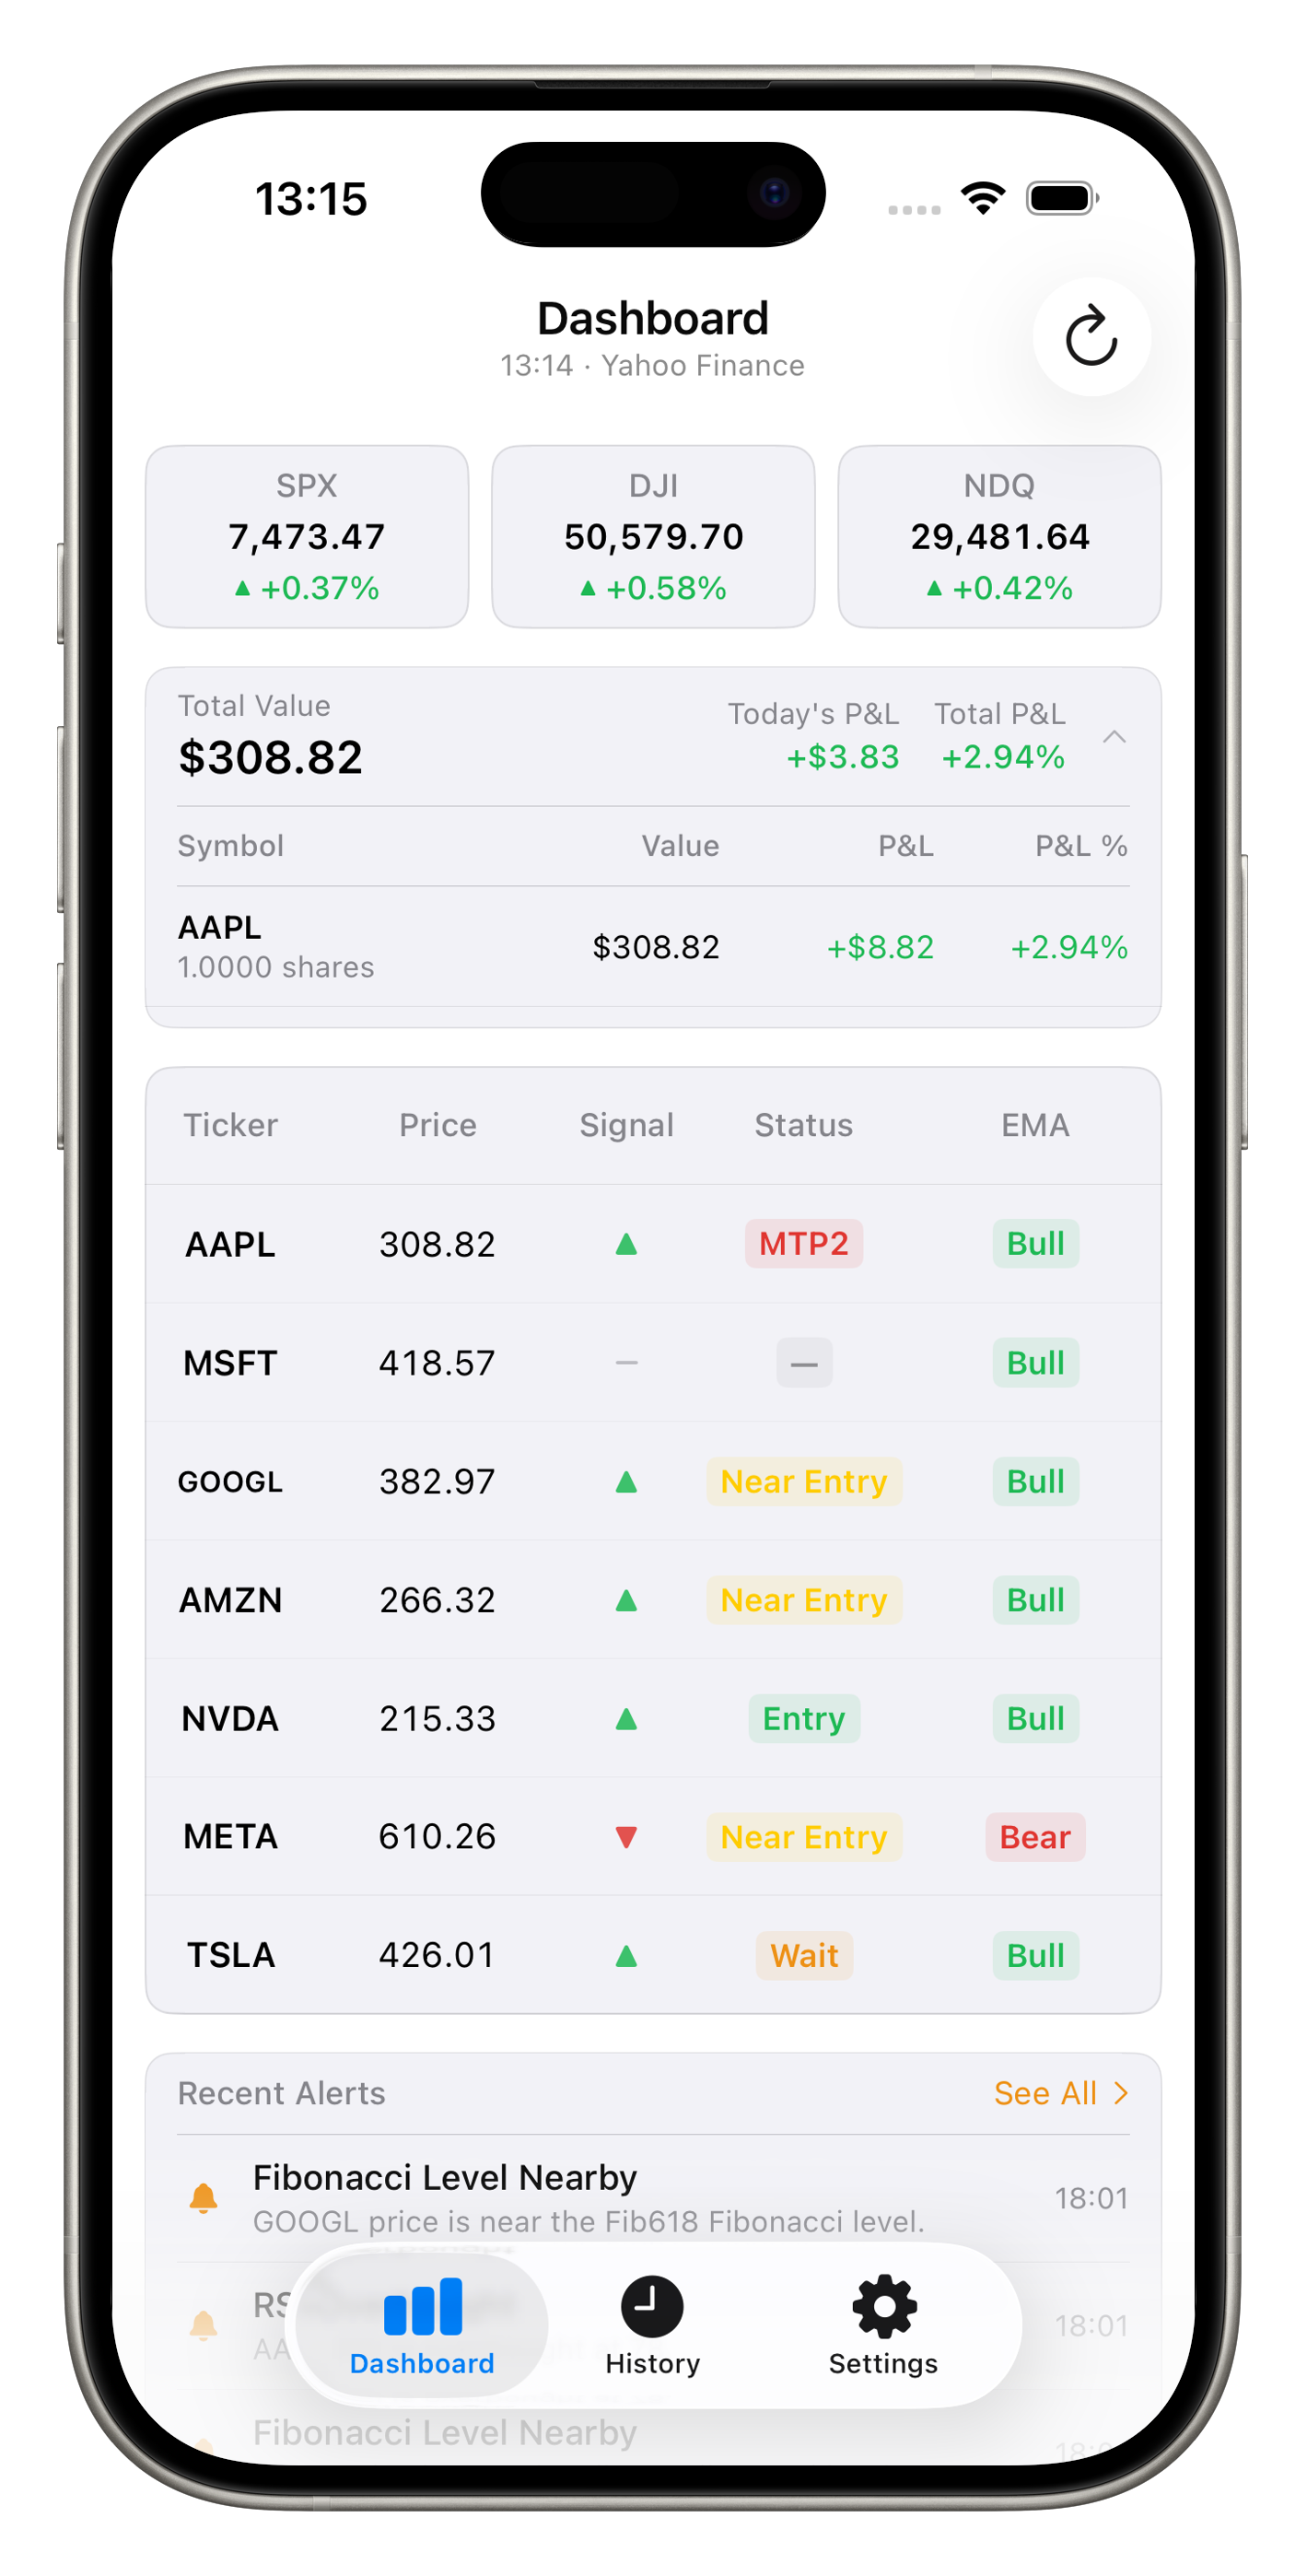
Full Dashboard
SPX · DJI · NDQ → portfolio → HUD → recent alerts
Market context (SPX, DJI, NDQ)
Three index cards show live price and day change. Tap any index to open its chart in Analysis mode. Use this as your macro filter before picking individual stocks.
Portfolio card and Portfolio tab
If you have recorded holdings, a Total Value card appears on the Dashboard below the indices, showing today's P&L and total return. Tap to expand and see per-symbol detail.
The dedicated Portfolio tab provides a full portfolio management view:
- Summary header: total value, day P&L, total P&L %, and position count
- Allocation donut chart: visual breakdown of portfolio weight by symbol
- Performance bar chart: ranked P&L % for each holding, sorted best to worst
- Holdings list: each position with direction badge (Long/Short), shares, current value, unrealised P&L, and strategy alignment indicator
- Analytics grid: concentration risk, best/worst performer, bias alignment, and flat positions
- Transaction history: full record of buys, sells, and closes with realised P&L
Portfolio prices and HUD prices are refreshed from the same live data source every 30 seconds. The Portfolio tab and Dashboard card are both omitted entirely when you have no holdings.
HUD table: strategy shortlist
The main table lists every watchlist symbol with live price, directional signal, setup status, and EMA trend. This is where you spot actionable trades.
Recent Alerts
Up to three of the latest intraday alerts appear in a card below the HUD, such as Fibonacci level proximity or RSI extremes. Tap a row to read the detail, or See All to open the full notification history.
Alerts are prompts to reopen the app and check a symbol; they do not execute trades automatically.
Signal (bias): which way is the trend?
| You see | What it means | Typical action |
|---|
| Long |
Uptrend structure confirmed. EMA stack and directional momentum favour swing entries on pullbacks. |
Look for swing long entries on pullbacks toward EMA 21 or VWAP. Ignore short ideas unless you hedge. |
| Short |
Downtrend structure confirmed. Favour selling rallies or avoiding new long exposure. |
Look for swing short entries near EMA 21 resistance. Be cautious adding long exposure. |
| Neutral |
No clear edge. ADX trend strength too weak, or indicators conflict. |
Stand aside. No entry/SL/TP is shown in Analysis for neutral symbols. |
Status: is now the right moment?
| You see | What it means | What traders often do |
|---|
| At Entry |
Price is within 0.5% of the calculated entry. Prime setup zone. |
Highest urgency: confirm in Analysis, size the trade, define SL/TP. |
| Near Entry |
Price is within 3% of entry. Setup forming but not yet at the structural level. |
Prepare limit orders or alerts; wait for price to reach entry or reject. |
| Wait |
Price is still far from the ideal entry. |
Monitor only. Check back at the next snapshot or on manual refresh. |
| Missed TP |
Price ran through a target without you entering at the planned level. |
Do not chase. Wait for a new snapshot or a fresh setup in History. |
| Invalidated |
Live price has crossed the stop loss level — the structural floor that defined the setup has been undercut. |
The setup thesis no longer holds. Do not enter. Look for a new signal on the next snapshot or after price reclaims the level. |
On the HUD, status labels are shortened to fit the column: Entry for At Entry; Near for Near Entry; Wait for Wait; MTP1, MTP2, MTP3 for Missed TP1, TP2, TP3; Invld for Invalidated.
Stars: how strong is the opportunity?
Stars summarise the setup quality on a 1 to 5 scale. The rating blends several classes of evidence, weighted by importance:
- Setup proximity — how close price is to the calculated entry zone (At Entry weighs far more than any other component; Missed TP and Invalidated pull the rating down).
- Trend strength and structure — whether a directional bias exists and how strongly the trend is confirmed.
- Momentum alignment — whether momentum and short-term trend direction support or oppose the bias.
- Participation — gap direction and volume behaviour relative to recent averages.
- Your news sentiment — the per-symbol adjustment you set in Settings (−2 to +2). It nudges the rating only; it never changes the Long/Short bias.
An At Entry setup with a strongly confirmed trend and aligned momentum easily reaches 4 to 5 stars. A setup where several evidence classes conflict lands at 2 to 3 stars even when the bias badge looks decisive.
Recovery signals and the 3★ cap. When MagTicker fires a recovery Long signal — price has reclaimed key structure with momentum supporting the move, but the slower trend measures have not yet fully realigned — and trend strength is not yet confirmed at that moment, the star rating is automatically capped at 3★. All risk levels are unchanged; only the displayed stars are limited.
A 3★ or below on a recovery signal tells you: the setup is structurally valid, but trend strength is not yet confirmed. Use smaller position size on these entries (for example, half your normal swing size). Wait until trend strength confirms on a subsequent snapshot before considering a full-size position in the same direction. If it never confirms and the trend structure stays mixed, re-evaluate whether the recovery is still intact.
Quick filter: On a busy day, focus on ★★★★+ symbols with At Entry or Near Entry status and ADX ≥ 25 first. Sort History by score to review how prior high-rated setups played out.
Refresh button (top-right): fetches latest prices and recalculates everything. A cooldown timer prevents overuse of your data API budget. Wait for the countdown if it is active.
Confirming in Analysis View
Never enter from the HUD alone. Tap through to Analysis to confirm chart structure, indicator readings, and exact risk levels before committing capital.
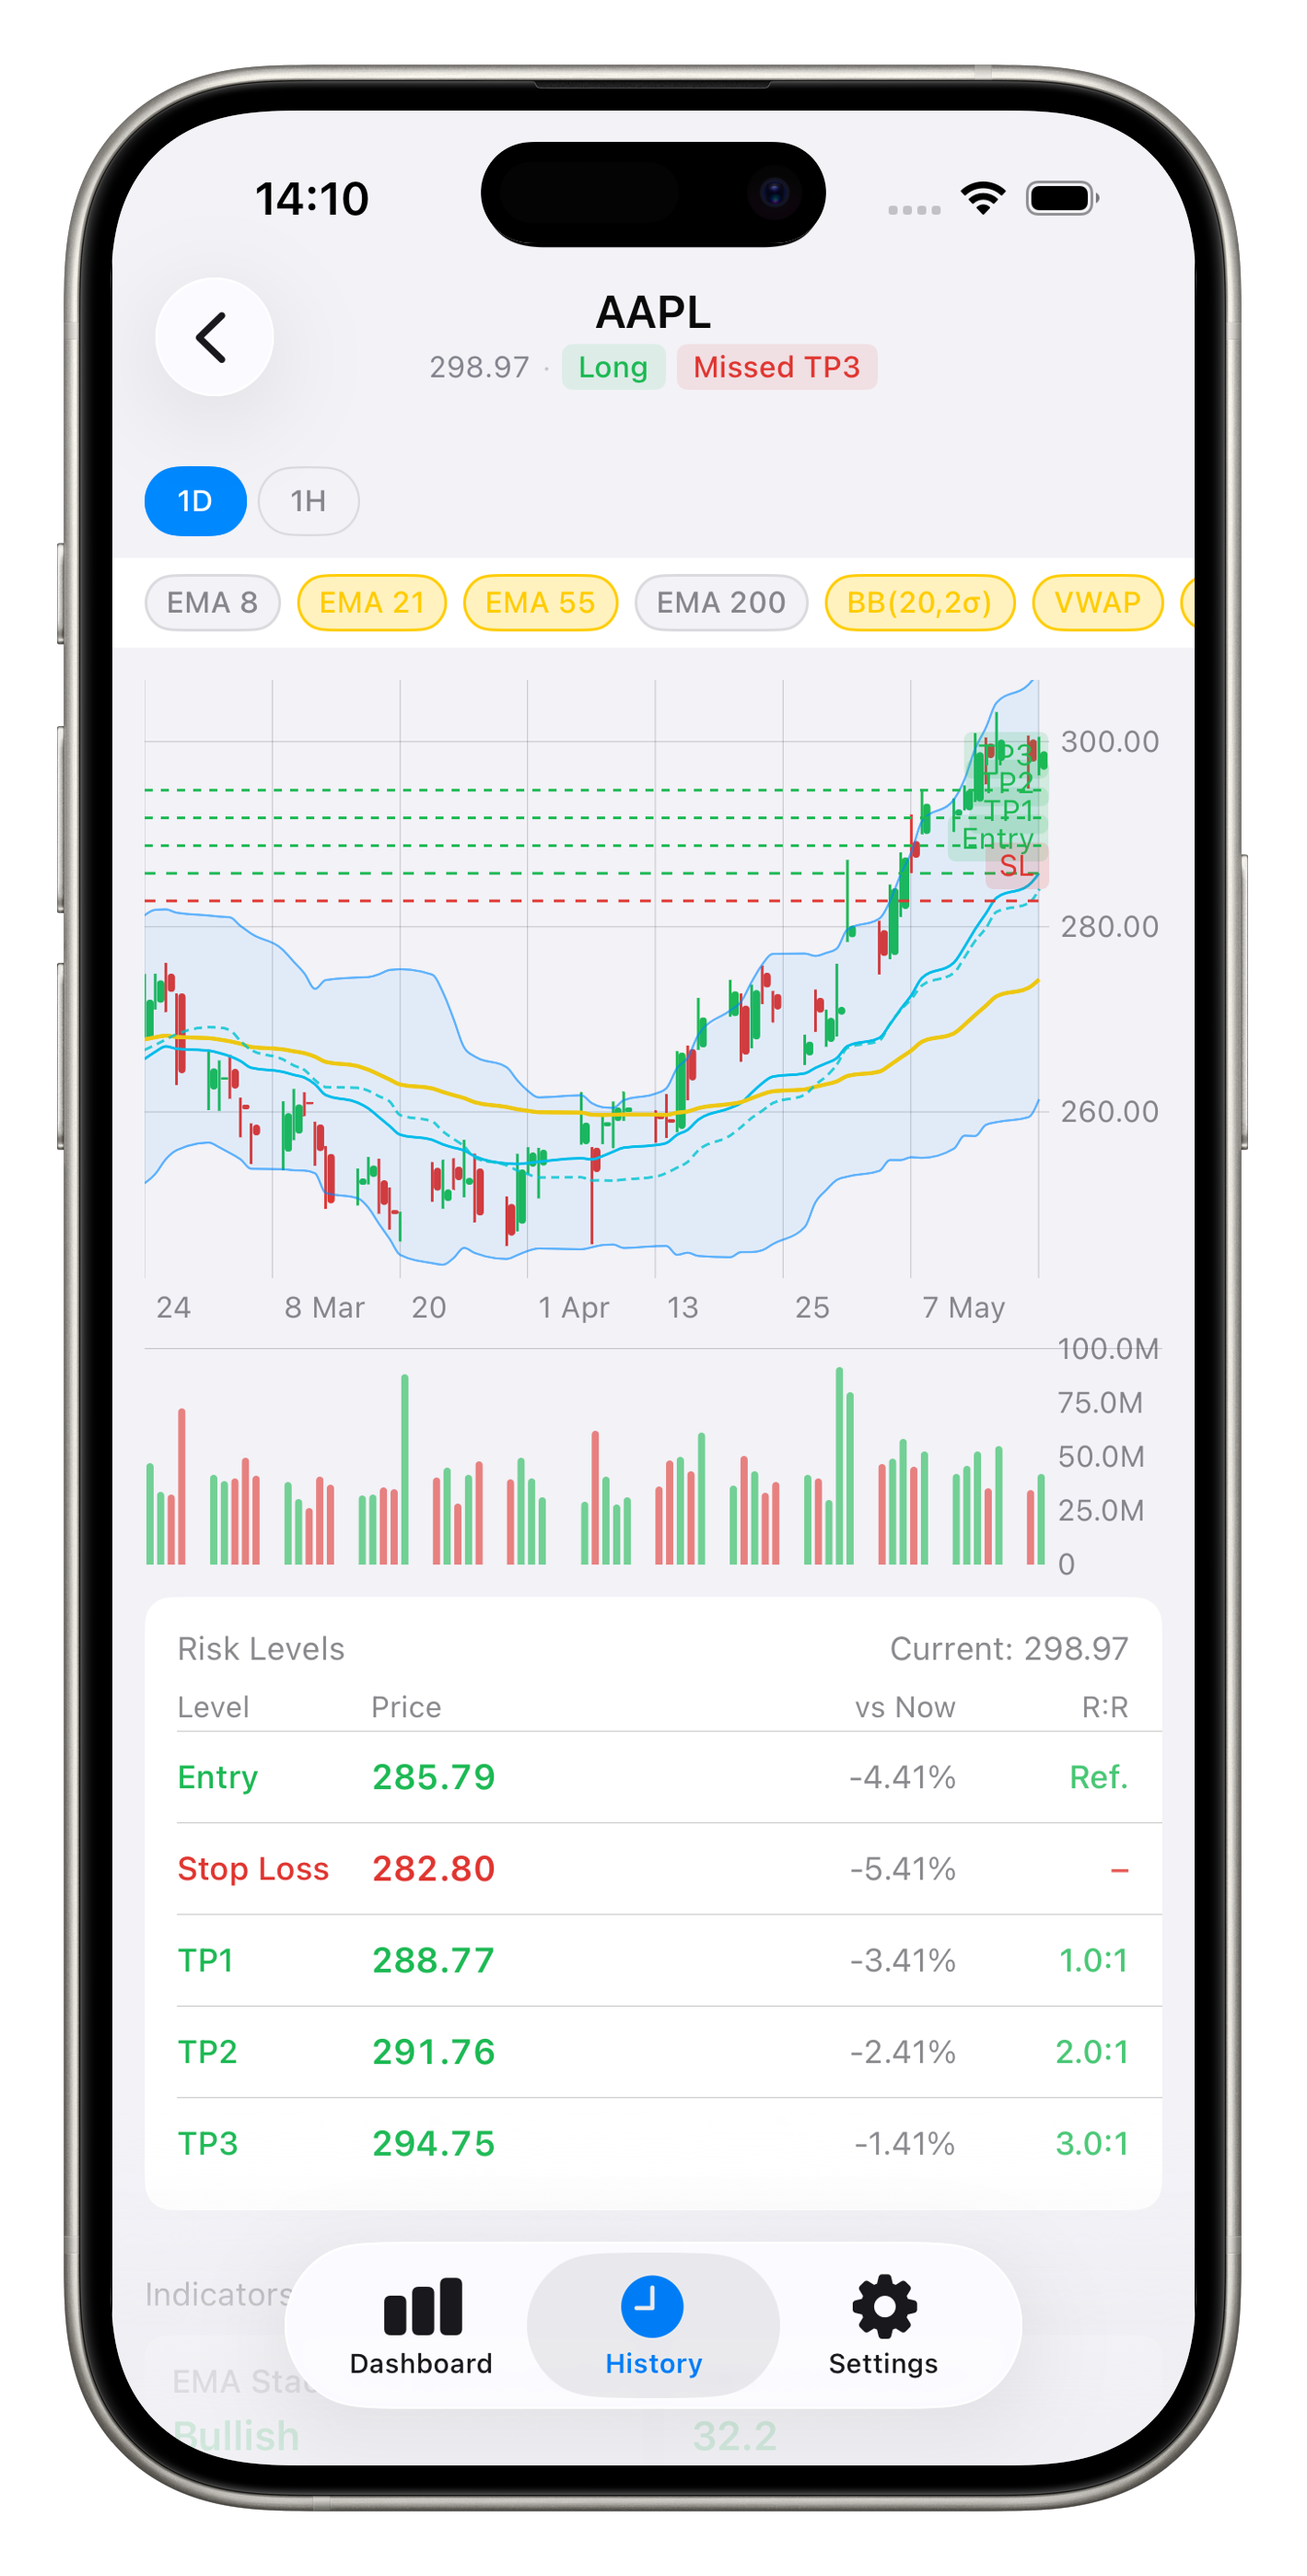
Analysis View
Chart · risk matrix · indicator grid · Fibonacci levels
📈
Chart & overlays
Toggle EMA 8/21/55/200, Bollinger Bands, VWAP, and Fibonacci. Ask: does price action support the bias shown on the Dashboard?
🎯
Risk levels matrix
Entry, Stop Loss, TP1, TP2, TP3 with distance from current price and reward-to-risk ratio. This is your trade plan template.
🧮
Indicator grid
RSI, ADX, StochRSI, MACD, volume ratio, and more. Weak trend strength usually means the signal is suppressed to Neutral, though an unusually strong volume surge can let a breakout signal through.
📏
Fibonacci section
See whether price sits near key retracement or extension levels. Levels marked NEAR can act as support, resistance, or TP alignment.
No risk levels card? If bias is Neutral, there is no valid directional setup and the risk levels section is hidden. Do not force a trade.
Predicted Trend: a second opinion, not a price target
At the bottom of the Strategy Summary card, the Predicted Trend section estimates the likely direction over the next 3–5 trading sessions. A panel of technical “voters” spanning trend structure, momentum, participation, and the strategy signal itself each casts a bullish, bearish, or neutral vote. The weighted tally sets the direction — Upward, Downward, or Sideways — and the signal agreement percentage shows how strongly the voters agree, after built-in safety reductions in market conditions where directional calls are known to be less reliable.
The mini-chart shows recent closes plus a shaded projection cone that widens with each future session — a deliberate reminder that uncertainty grows with time. The cone’s center line tilts in the forecast direction, and the tilt gets steeper as signal agreement rises — so a low-agreement Downward call shows only a gentle down-drift inside a wide band, while a high-agreement call tilts decisively. A Sideways forecast draws a flat cone. Every voter’s contribution is listed below the chart, so you can always see why the forecast says what it says.
How to use it (and how not to). The forecast measures short-horizon direction; the Signal (bias) measures pullback-entry setup quality. They can legitimately disagree — when they do, the app tells you. Directional accuracy for any daily-candle system is only modestly better than a coin flip (validated in-house across a full MAG-7 backtest year: higher agreement percentages are measurably more reliable than lower ones, which is exactly what the gauge is for). Treat it as a technical outlook that helps with timing and expectation-setting — never as a price prediction. Sizing, stops, and entries should still come from the Risk Levels matrix.
“Strong Downtrend” headline but low signal agreement? Not a contradiction — they measure different things. The headline names the structural entry condition that fired — a trend-structure pattern that can remain in force even while shorter-term momentum shifts against it. The agreement gauge polls the full voter panel, including faster momentum and slope readings. A strong structural condition with low agreement means momentum is currently pushing against the established trend — often an early warning that the trend is being tested. The star rating usually confirms this: a “strong” condition with countering momentum scores low stars too. Read all three together: condition = pattern, stars = opportunity quality, agreement = short-horizon consensus.
The forecast design follows the academic literature on technical analysis: moving-average and momentum rules carry measurable predictive content (Brock, Lakonishok & LeBaron 1992, Journal of Finance; Neely, Rapach, Tu & Zhou 2014, Management Science; Moskowitz, Ooi & Pedersen 2012, Journal of Financial Economics), and trend rules work best in confirmed-trend regimes (Han, Yang & Zhou 2013, JFQA). The always-modest confidence ceiling reflects the documented limits of out-of-sample return predictability (Timmermann 2008; Fama 1970).
Building Your Trade Plan
MagTicker gives you a complete swing trade plan: a structural entry, a volatility-sized stop, and three scaled take-profit targets. Adapt position size to your risk tolerance, not the stop width.
Entry
The entry level marks the strongest structural support (Long) or resistance (Short) zone identified from the daily indicators. This is the zone where the strategy expects a pullback (Long) or a bounce (Short) before the move continues. Swing traders typically watch for price to approach this zone over 1 to 3 days before entering.
Your job: Decide whether to enter at market, place a limit at the shown entry level, or wait for a daily candle close confirmation. For swing trades, a daily close above (Long) or below (Short) the entry level is a common confirmation approach.
Stop loss
The stop loss is sized to the symbol's recent daily volatility so normal price swings do not stop you out prematurely, and it tightens toward nearby structure when a meaningful level sits between entry and the base stop. The stop defines your maximum dollar risk per share.
Your job: Never widen the stop beyond what your account can afford. If the dollar risk per share is too large, reduce position size. Never move the stop further away from entry once placed.
Take profits (TP1, TP2, TP3)
Targets are set at fixed multiples of your risk (the distance from entry to stop loss) — TP1 at 1R, with TP2 and TP3 as progressively more ambitious runner targets. TP3 may additionally align itself with a nearby structural extension level, producing natural swing targets rather than arbitrary multiples. The exact R:R of every level is shown in the risk matrix.
| Level | Default action | Hold condition for runner |
|---|
| TP1 (1R) |
Take 50% off. Move stop to breakeven on remainder. |
Always execute — this is the primary swing target. |
| TP2 (2R) |
Close the remainder if ADX is below 30 or EMA stack is mixed. Trail stop otherwise. |
ADX ≥ 30 and EMA stack aligned with your bias. If either fails, take full profit at TP1 instead. |
| TP3 (2.5R) |
Bonus runner only. May align with a Fibonacci extension (R2/R3 for Long; S2/S3 for Short). |
Strong trend only: ADX ≥ 30, EMA stack aligned, and price made a clean break above TP2 without stalling. Do not expect TP3 as default. |
TP2 and TP3 are conditional targets, not automatic ones. A one-year backtest across all seven MAG-7 stocks showed TP1 reached in roughly 87% of resolved signals, TP2 in about 1 in 5 (20%), and TP3 — at its current 2.5R target — in roughly 1 in 12 (8%). The most reliable approach is to secure TP1, then hold a runner only when trend structure remains strong: ADX 30 or above, EMA stack aligned with bias, and price continuing to make new legs.
Example: Long swing trade on AAPL
Dashboard shows Long · Near Entry · ★★★★☆ · ADX 32 · EMA stack bullish
Analysis risk matrix: Entry $185.00 · SL $180.00 · TP1 $190.00 · TP2 $195.00 · TP3 $197.50
Risk per share: $5.00. With $500 per-trade risk, buy 100 shares. Place stop at $180.00.
At TP1 ($190): Sell 50 shares. Move stop to breakeven ($185) on the remaining 50. ADX is still 32 and EMA stack is bullish — hold the runner toward TP2.
If ADX had been 22 at entry: Plan would be to close the full position at TP1 and not hold a runner, since trend strength is unconfirmed.
If Missed TP shows before you enter: Skip the trade. Do not chase. Wait for a fresh setup at the next snapshot.
Trading Long vs Short
The strategy engine treats both directions symmetrically and sizes the stop identically. Your broker access and account type determine which direction you can trade.
▲
Long setups
Buy near the entry level, stop below SL, take-profit targets above. Best when SPX context is bullish or flat and status is At Entry or Near Entry. Swing longs typically hold for 2 to 10 trading days.
▼
Short setups
Sell or short near the entry level, stop above SL, targets below. Requires a margin or short-enabled account. Extra caution in strong index up-days. Swing shorts often trigger during broad market weakness sessions.
Near Entry fires when price is within 3% of the entry level — on either side. For a Long, this covers both a pullback toward the support level and a brief dip slightly below it before recovering. For a Short, it mirrors: within 3% of the entry resistance from above or below. This is the ideal waiting zone for limit orders or alerts.
Notifications & Timing
Five scheduled anchor notifications are the backbone of your swing trading routine. Each one is an opportunity to review active positions, find new setups, and stay aligned without screen-watching. The first four fire Monday through Friday; the Weekly Report fires on Fridays only.
Enable notifications on first launch. If you skipped the prompt, go to Settings → MagTicker → Notifications. Five anchors run in your device’s local timezone. Adjust times in Settings → Notifications to match your market hours.
-
Pre-Market
Plan the trading day
Review directional bias for every symbol before the US session opens. Build your shortlist of names with Long or Short bias and At Entry or Near Entry status. This is your primary swing setup scan for the day.
-
Open
Confirm opening structure
Review how the open print affected strategy levels. Overnight gaps can shift status from Near Entry to At Entry or push a setup past a TP level. Verify your planned entries are still valid.
-
Mid-Session
Midday check
Re-evaluate Near Entry names. Did price reach the zone and offer a fill? Did it bounce away and reset to Wait? This is also a good time to trail stops on profitable positions.
-
Close
End-of-day review
Final daily close prices, scores, and risk levels saved to History. Review which setups moved, which reset to Wait, and whether any open positions hit their first target. A brief journal entry in your notes app here builds long-term discipline.
-
Weekly
Weekly perspective
Step back from the daily view. Check which symbols have sustained Long or Short bias across the week, which ones reversed, and whether any approaching-entry setups set up for the following week.
Intraday alerts
During your configured alert window (default 14:00 to 20:00 local time), the app fires at most one notification per symbol per condition per day when any of these conditions are met:
- RSI rises above 70 (overbought) or drops below 30 (oversold)
- Status reaches At Entry while bias is not Neutral
- Close moves above the Bollinger upper band or below the lower band
- Volume spikes to 2× or more above the 20-day average
- Close comes within 0.5% of any Fibonacci level
Each condition resets at local midnight. Treat alerts as prompts to open the app and review the symbol. They are not automatic trade signals and do not use a separate intraday strategy pass.
Using History to Improve
Every snapshot is saved - use it as a trading journal.
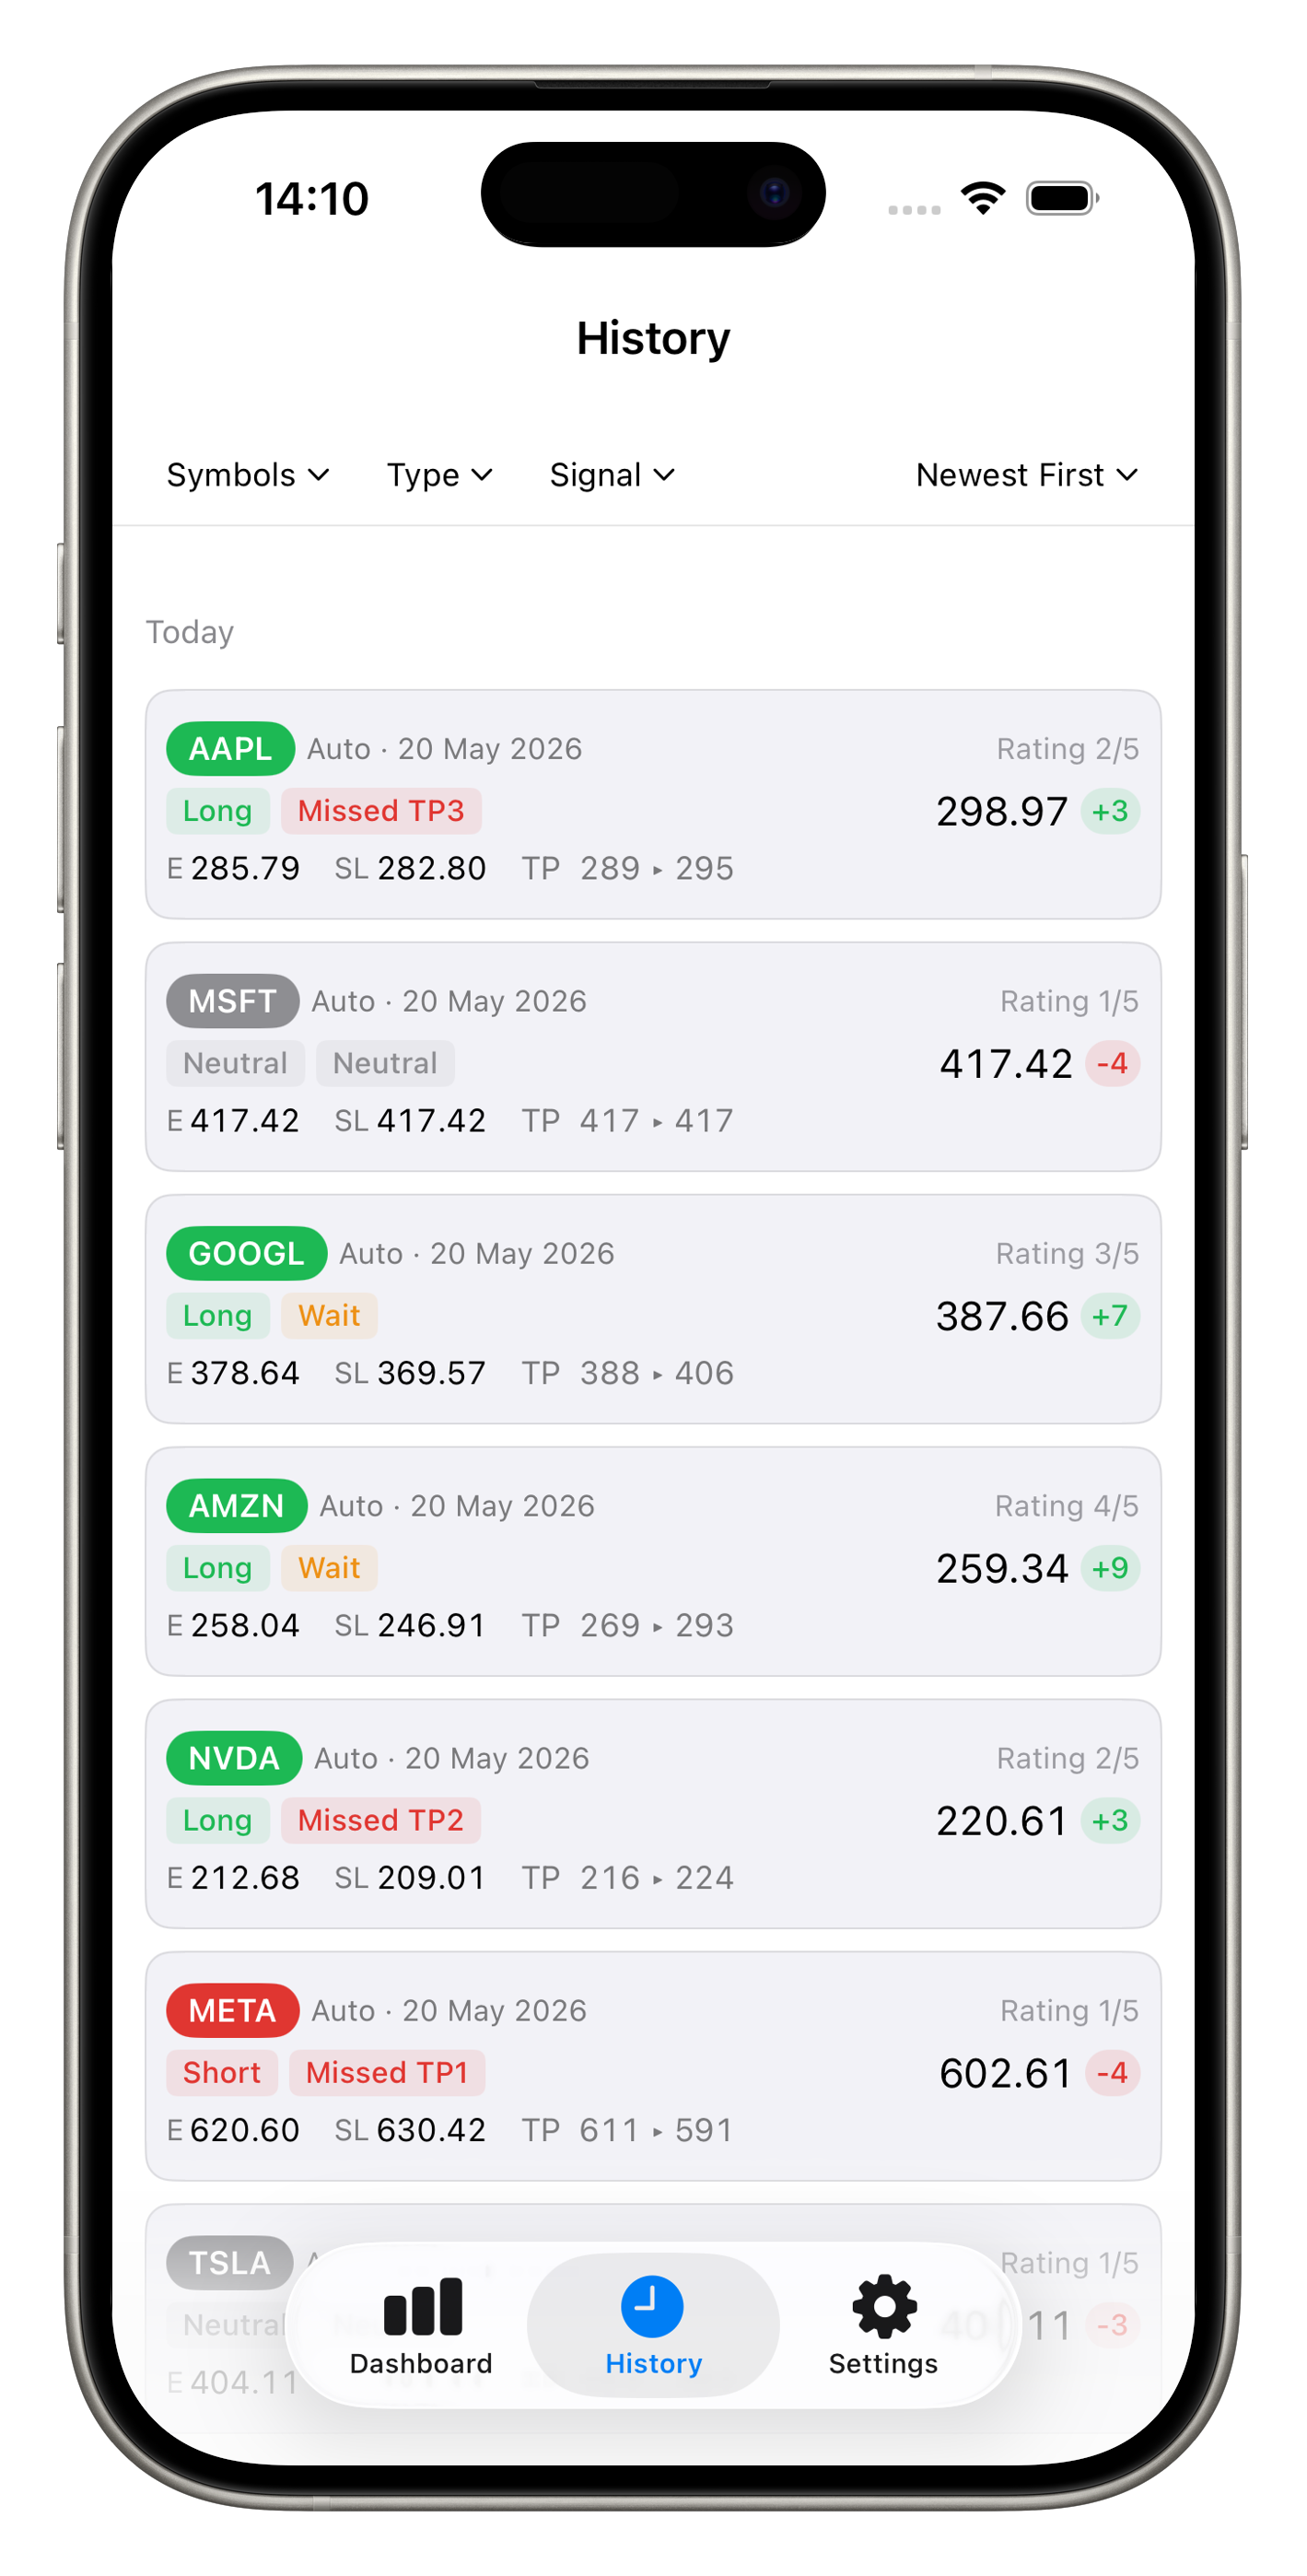
History
Filter by symbol, session type, or bias · long-press to pin or delete
- Filter by anchor: compare Pre-Market vs Close snapshots for the same symbol to see how levels shift across the session.
- Sort by score: find which setups rated highest before they played out. This is the fastest retrospective filter for swing trade quality.
- Pin important rows: long-press a snapshot to keep it beyond the 30-day auto-cleanup. Pin completed trades to review the entry date levels against the outcome.
- Tap any row: reopen Analysis in read-only mode to see exactly what the chart and indicators showed on that specific anchor date.
Settings That Affect Your Trading
Optional tweaks - defaults work well for most users.
| Setting | Where | Why it matters |
|---|
| Symbol watchlist |
Settings → Symbols |
Up to 10 tickers. MAG-7 are preloaded. Add liquid equities you actively swing trade. |
| News sentiment |
Settings → News Sentiment |
Adjusts star score only (+2 to −2 per symbol). Does not change Long or Short bias. Useful when you have an event-driven view on a specific name. |
| Indicator parameters |
Settings → Indicators |
Advanced. Changing any value triggers a full recalculation across all symbols. Defaults are tuned for MAG-7 swing trading. Reset to defaults if unsure. |
| Notification schedule |
Settings → Notifications |
Adjust anchor times to your timezone and trading session. Also configures the intraday alert window (start and end hour). |
| Refresh & cooldown |
Settings → Refresh Limits |
Controls manual refresh cooldown and auto-refresh interval. For paid API subscribers, intervals from 1 minute are available. Free-tier users should keep this at 30 minutes or above to avoid rate limiting. |
| Portfolio |
Settings → Portfolio |
Record symbol, quantity, average cost, direction (long/short), and purchase date. Sell or close positions with realised P&L tracked in transaction history. MagTicker stores the original SL and TP levels from your entry date so you always have the original trade plan visible. |
Common Mistakes to Avoid
These trip up new users most often.
Trading Neutral signals
If bias is Neutral, ADX is too weak or indicators conflict. There is no valid swing setup. Wait for the next snapshot or anchor.
Chasing Missed TP
Missed TP status means price already passed the planned entry zone. Do not chase the move. Wait for a fresh setup at the next snapshot.
Ignoring the stop loss
The SL is integral to the system. The R:R math for TP1, TP2, and TP3 only holds if you honour the stop. Moving the stop wider after entering invalidates the plan.
Using 1H chart for entry levels
The hourly chart is for visual context only. Entry, SL, and TP levels are all computed on daily candles. Do not use intraday price action to override the daily levels.
Expecting same-session results
Swing trades take 2 to 15 trading days to reach their targets. Do not close a trade after one day simply because it has not moved. Reassess at each anchor notification.
Expecting auto-execution
MagTicker is analysis-only. You must place orders in your broker. Alerts are reminders to review, not instructions to execute.
Over-trading every Long or Short
Prioritise At Entry status, star ratings of 3 or above, and broad index alignment. Not every Long or Short badge warrants a position.
Holding runners without ADX support
TP2 and TP3 are conditional targets, not defaults. Holding past TP1 when ADX is below 30 or the EMA stack is mixed results in giving back profit on a reversal. Take full profit at TP1 if trend strength is not confirmed, and re-enter on a fresh signal.
Full-sizing a 3★ recovery signal
A 3★ or below star rating on a recovery Long means trend strength has not confirmed yet. These setups succeed, but at a lower rate than confirmed-trend signals. Use half your normal position size and plan to exit at TP1 only, unless trend strength confirms on a subsequent refresh.
Skipping the Analysis view
Never enter from the HUD alone. Always tap through to the full Analysis view to confirm chart structure, ADX, RSI, and the exact risk matrix levels before placing an order.
Pre-Trade Swing Checklist
Run through this list before every position. All points must pass.
- Bias is Long or Short. Not Neutral.
- Status is At Entry or Near Entry. If Wait, you have a specific trigger defined for when to enter.
- Star rating meets your minimum threshold (3★ minimum; 4★ or above for full-size swings).
- If stars are 3★ or below on a recovery Long signal: trend strength has not yet confirmed — the recovery is early-stage. Use half your normal position size. Do not plan to hold beyond TP1 unless trend strength confirms on a later snapshot.
- Analysis view confirms: chart trend supports bias, ADX is 25 or above (or volume breakout justifies entry), volume ratio is healthy.
- TP exit plan decided before entry: close full position at TP1 if ADX < 30 or EMA stack is mixed. Hold a runner to TP2 only if ADX ≥ 30 and stack is aligned.
- Entry, SL, TP1 (and optionally TP2) written down. Position size calculated so Entry-to-SL equals your per-trade risk in dollars.
- Index context (SPX, DJI, NDQ) is not strongly opposing your direction.
- Order placed and take-profit alerts set in your broker. MagTicker does not execute orders.
Disclaimer
MagTicker provides technical analysis for informational and educational purposes only. It is not investment advice, a solicitation, or a guarantee of results. Trading involves risk of loss. You are solely responsible for your decisions.
Read the full MagTicker Disclaimer and Privacy Policy.