Strategy signals, candlestick charts, risk levels, and automated market notifications for the world's most-watched stocks - all processed on your device.
AAPLMSFTGOOGLAMZNNVDAMETATSLA
📊
Live Signals
Long / Short / Neutral
📈
Chart Overlays
EMA, BB, VWAP & more
🎯
Risk Levels
Entry, SL, TP1-TP3
🔔
Auto Alerts
5 daily market anchors
🔒
Privacy First
No analytics, no ads
Dashboard - All 7 at a Glance
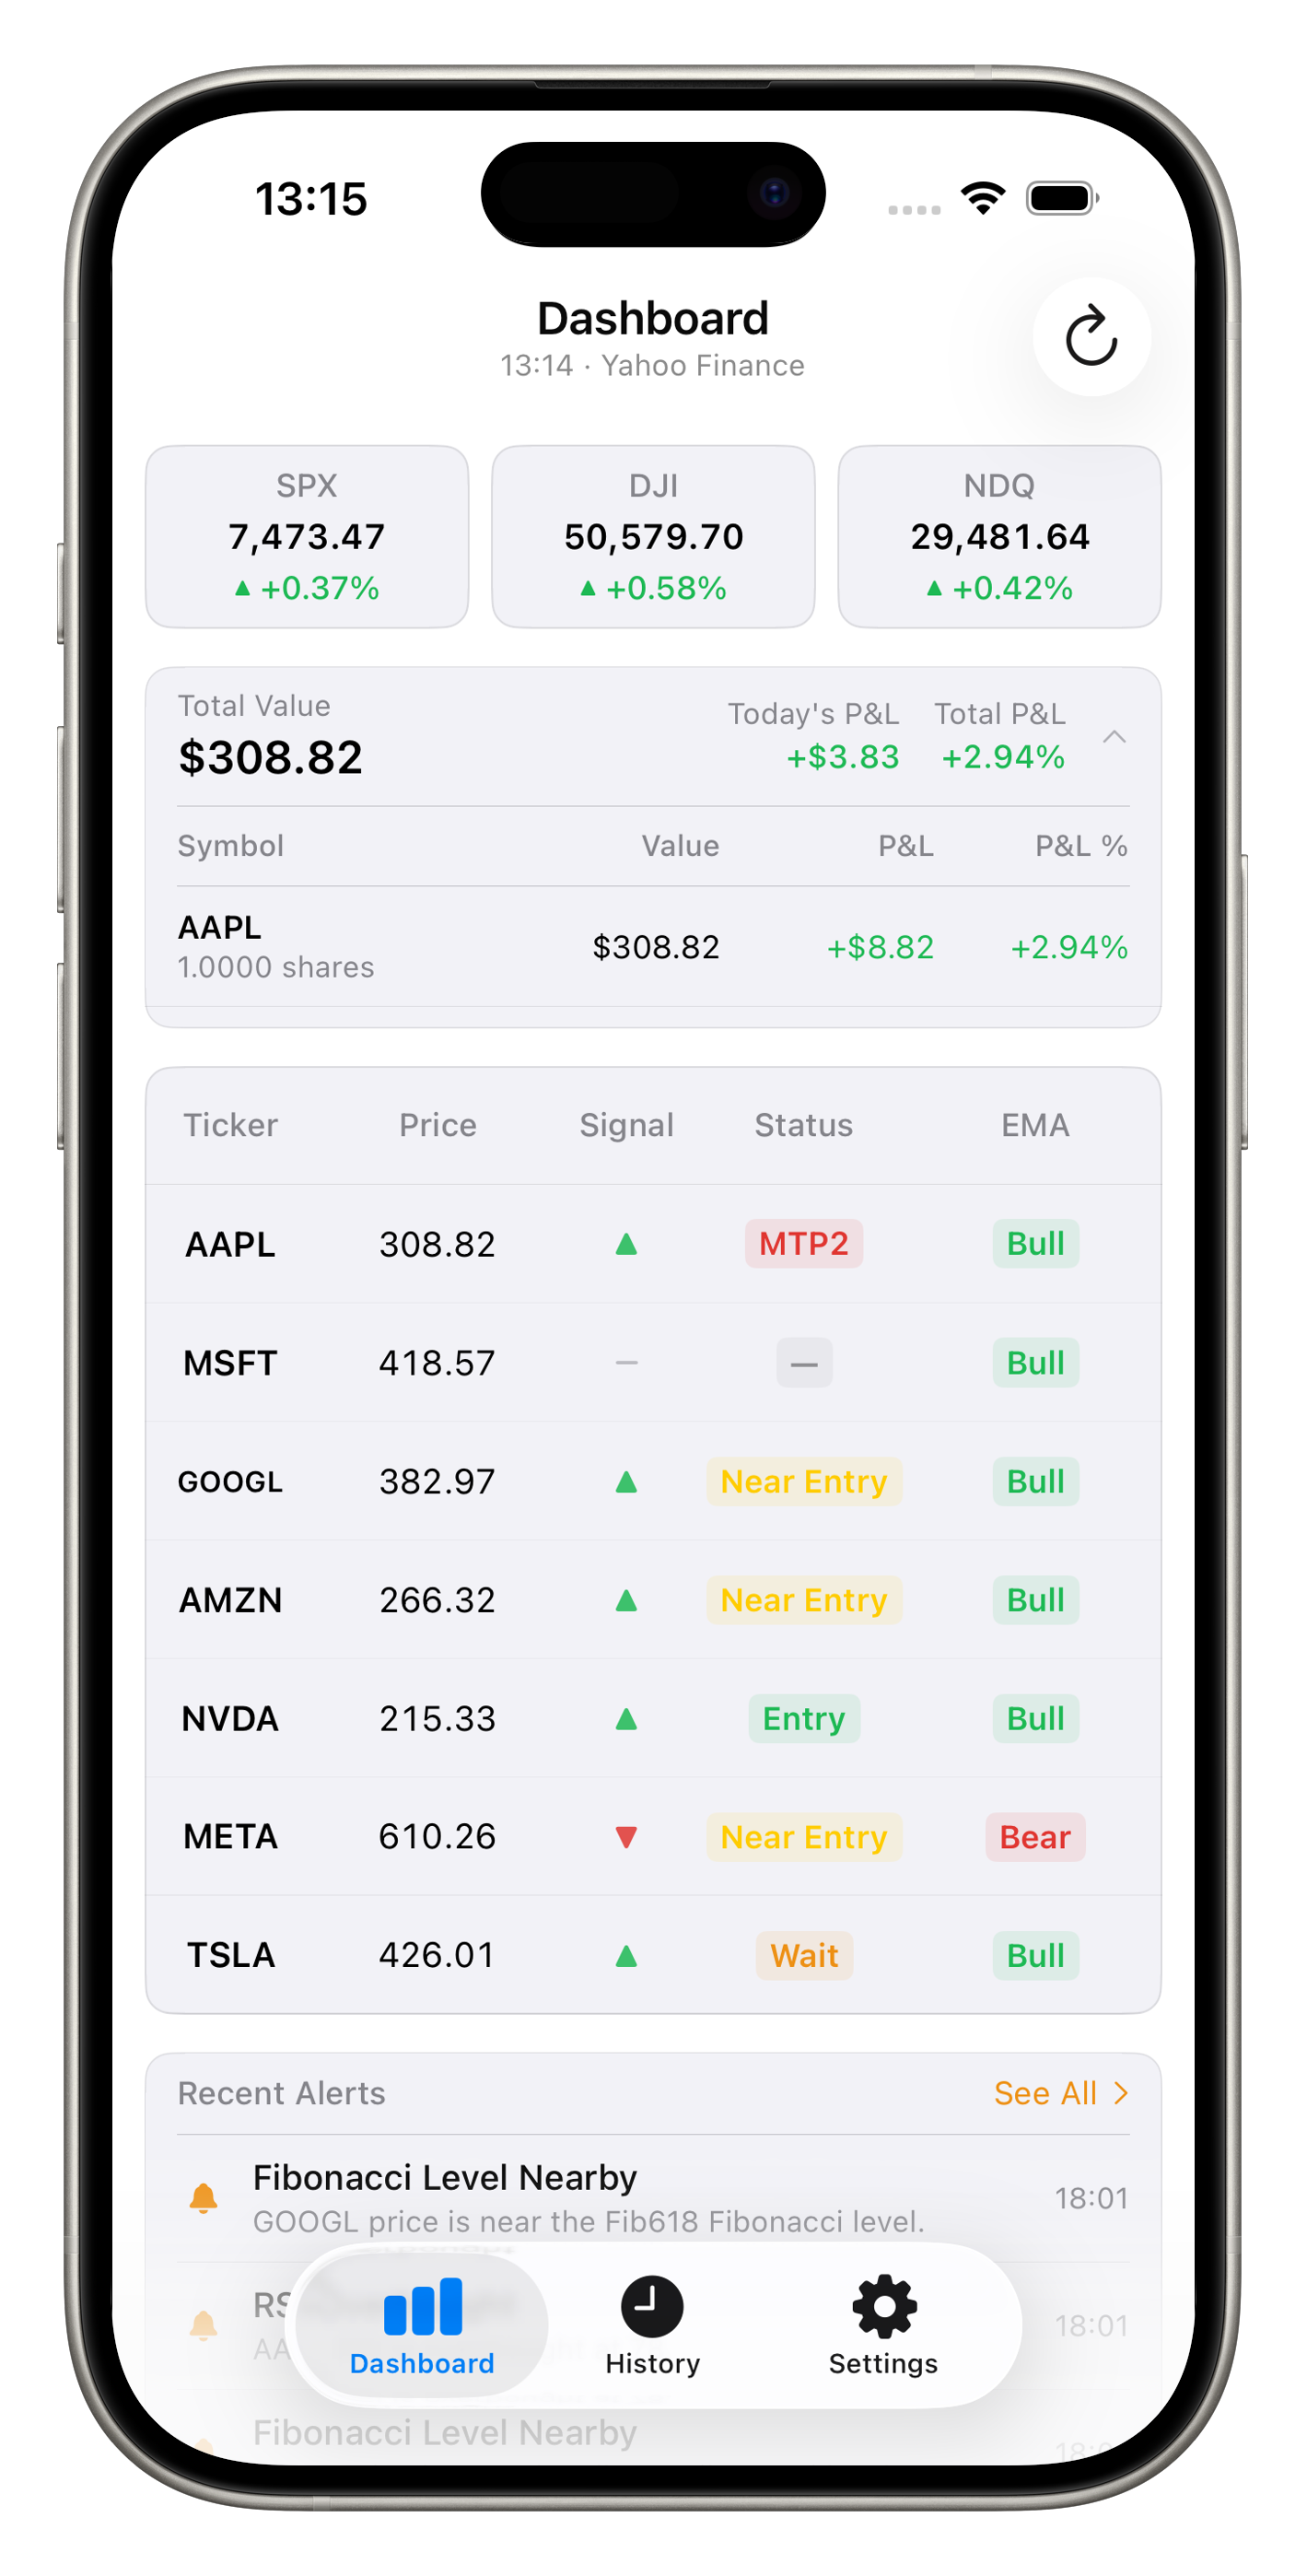
Scroll one screen for market context, your portfolio, strategy signals on every MAG-7 stock, and the latest intraday alerts.
Live Dashboard
Indices at the top · portfolio summary · HUD table · recent alerts at the bottom.
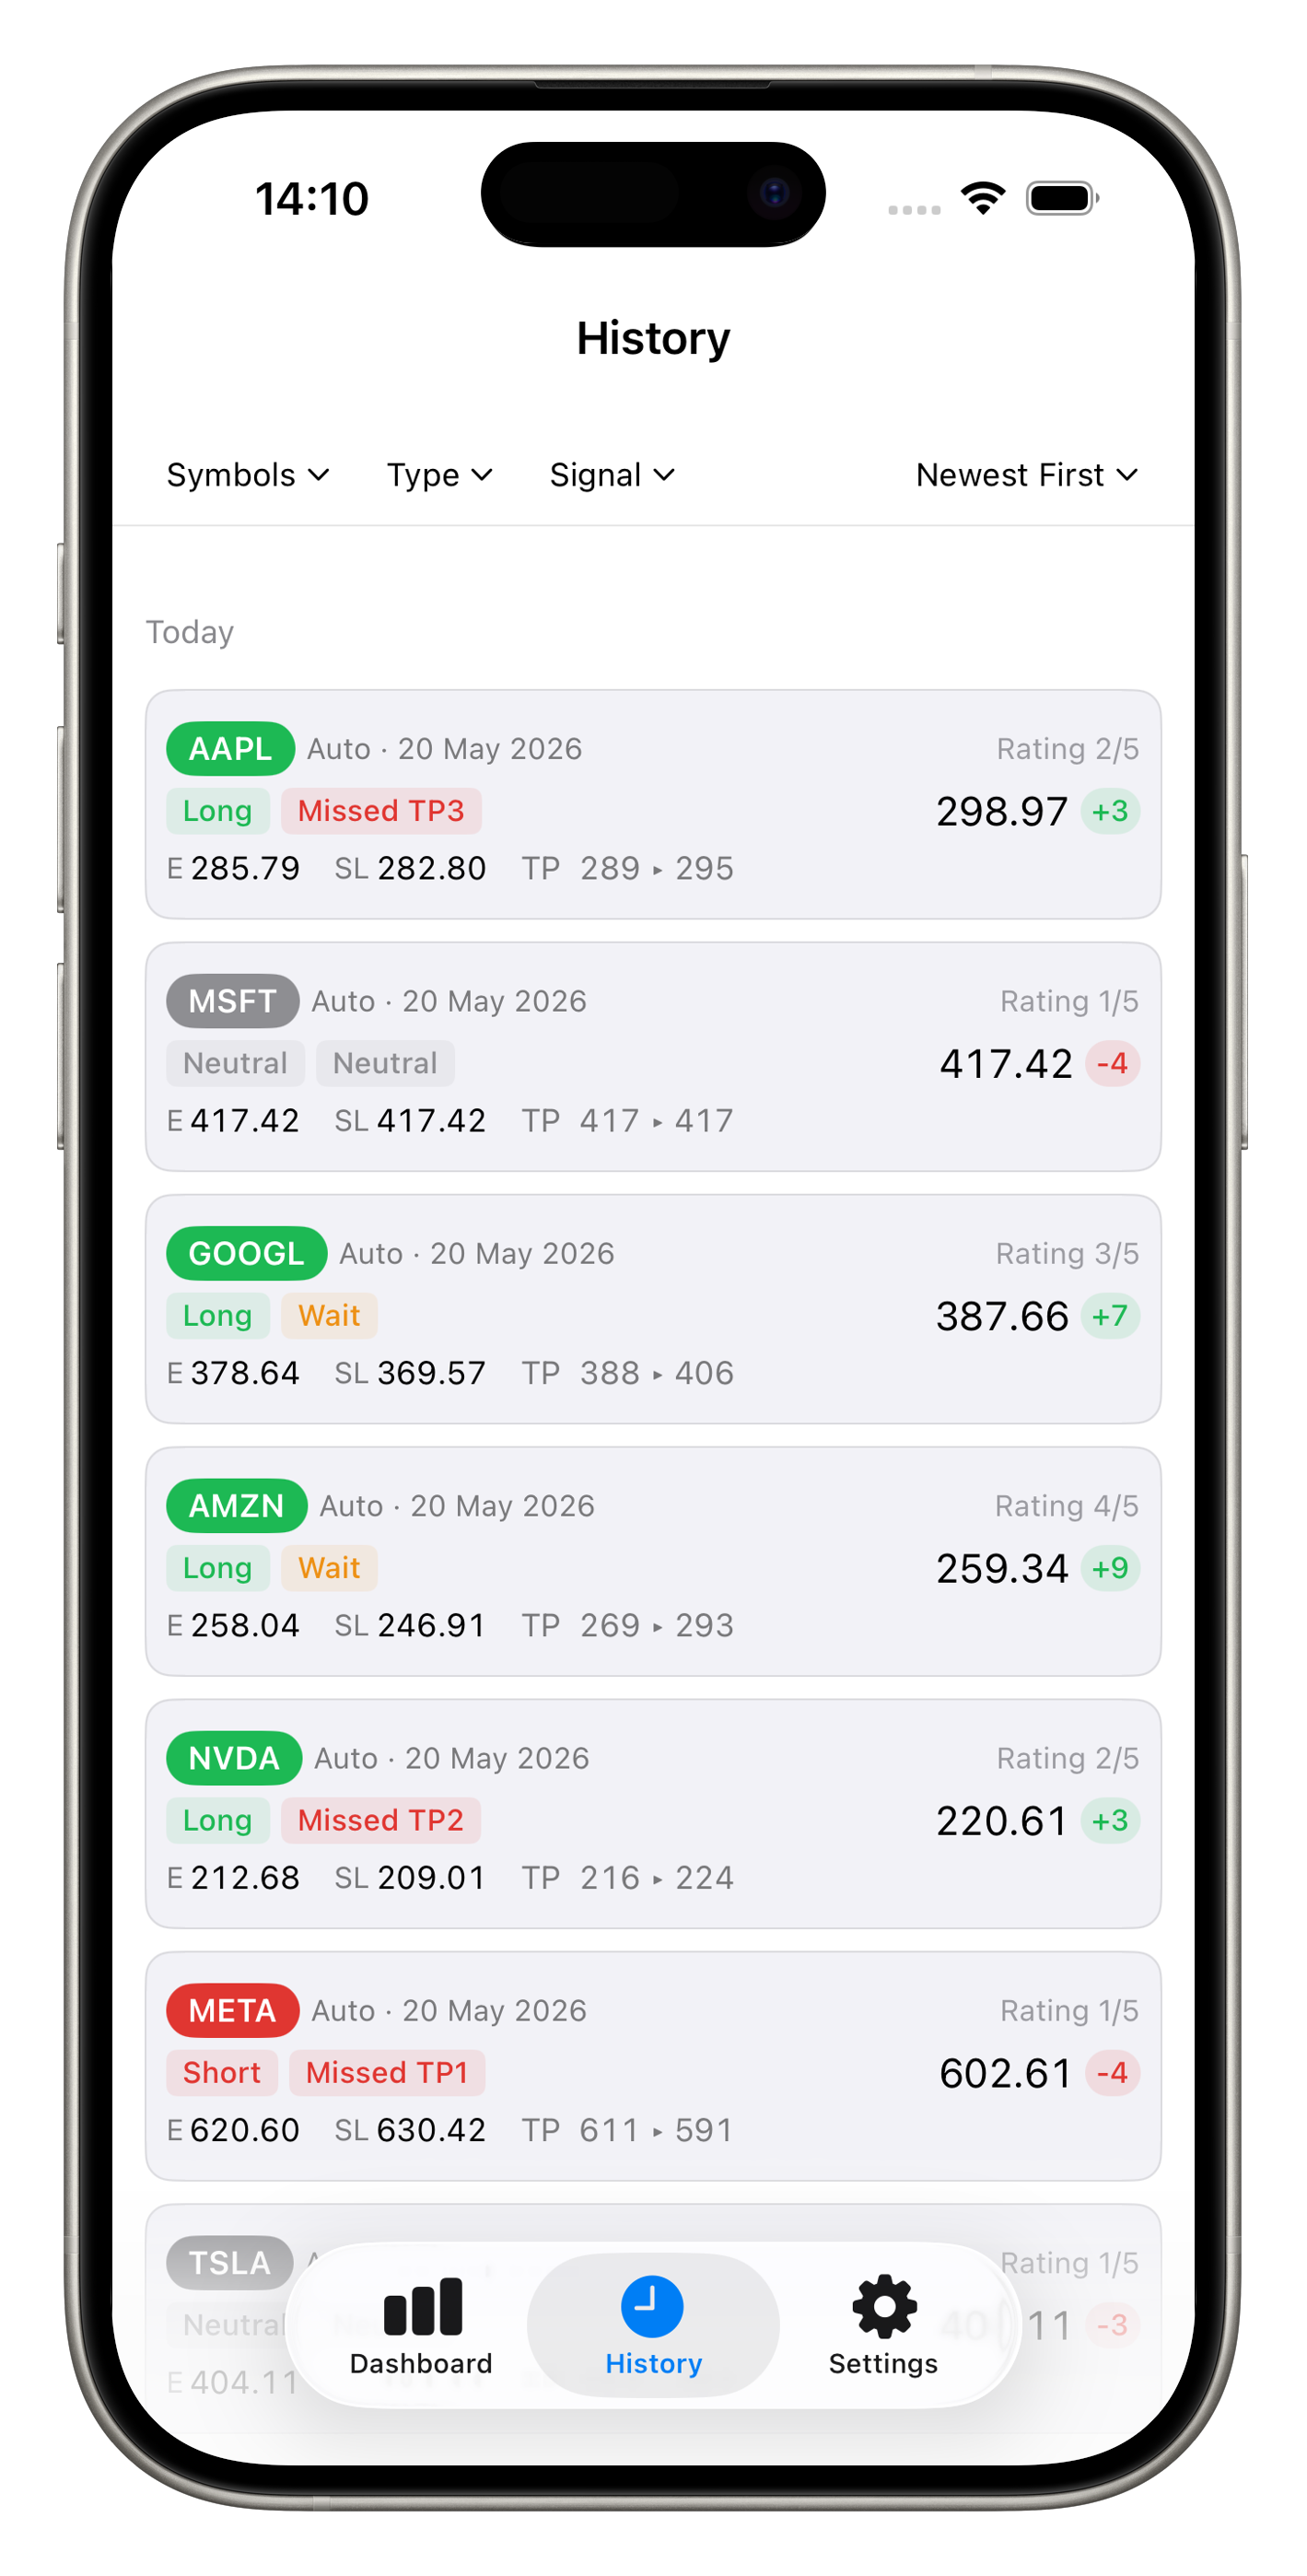
Strategy History
Every saved snapshot with full entry, stop loss, TP1-TP3 levels, and star ratings.
📉
Market Context Bar
SPX, DJI, and NDQ index moves shown at the top of the dashboard with an overall market bias (Bullish / Bearish / Neutral).
💼
Portfolio Summary
When you have holdings, a Total Value card shows today's P&L, total P&L %, and a per-symbol breakdown (shares, value, P&L). Tap to expand. Hidden when empty.
▲
Strategy Signals
Each symbol shows a Long ▲, Short ▼, or Neutral - signal derived from EMA stack alignment, ADX trend strength, and RSI confirmation.
🔔
Recent Alerts
The latest intraday notifications - RSI extremes, Fibonacci proximity, at-entry hits, and more. Tap See All for the full notification history.
🔄
One-Tap Refresh
Tap the refresh button in the top-right corner to fetch the latest prices and recalculate all signals. A cooldown timer prevents API rate overuse.
Understanding Strategy Signals
MagTicker uses a multi-indicator scoring engine to classify each stock's strategy state at every market snapshot.
The Signal column shows the directional bias. The Status column shows where the current price sits relative to the calculated strategy levels. The EMA column shows whether the price is above or below the 21-period EMA.
Bearish bias - EMA stack aligned downward, trend confirmed
Neutral -
Mixed or weak signals - no high-confidence directional trade
Status
At Entry
Price is within 0.5% of the calculated entry level - prime setup zone
Near Entry
Price is within 3% of entry - approaching the setup
Wait
Price has not reached the entry level yet - monitor only
Missed TP1-3
Price has moved beyond one or more take profit targets
EMA
Bull
Price is trading above the EMA 21 - bullish bias confirmed
Bear
Price is trading below the EMA 21 - bearish structure
The HUD uses compact labels where space is tight - Entry means At Entry; MTP1, MTP2, and MTP3 mean Missed TP1-3.
Analysis View & Candlestick Charts
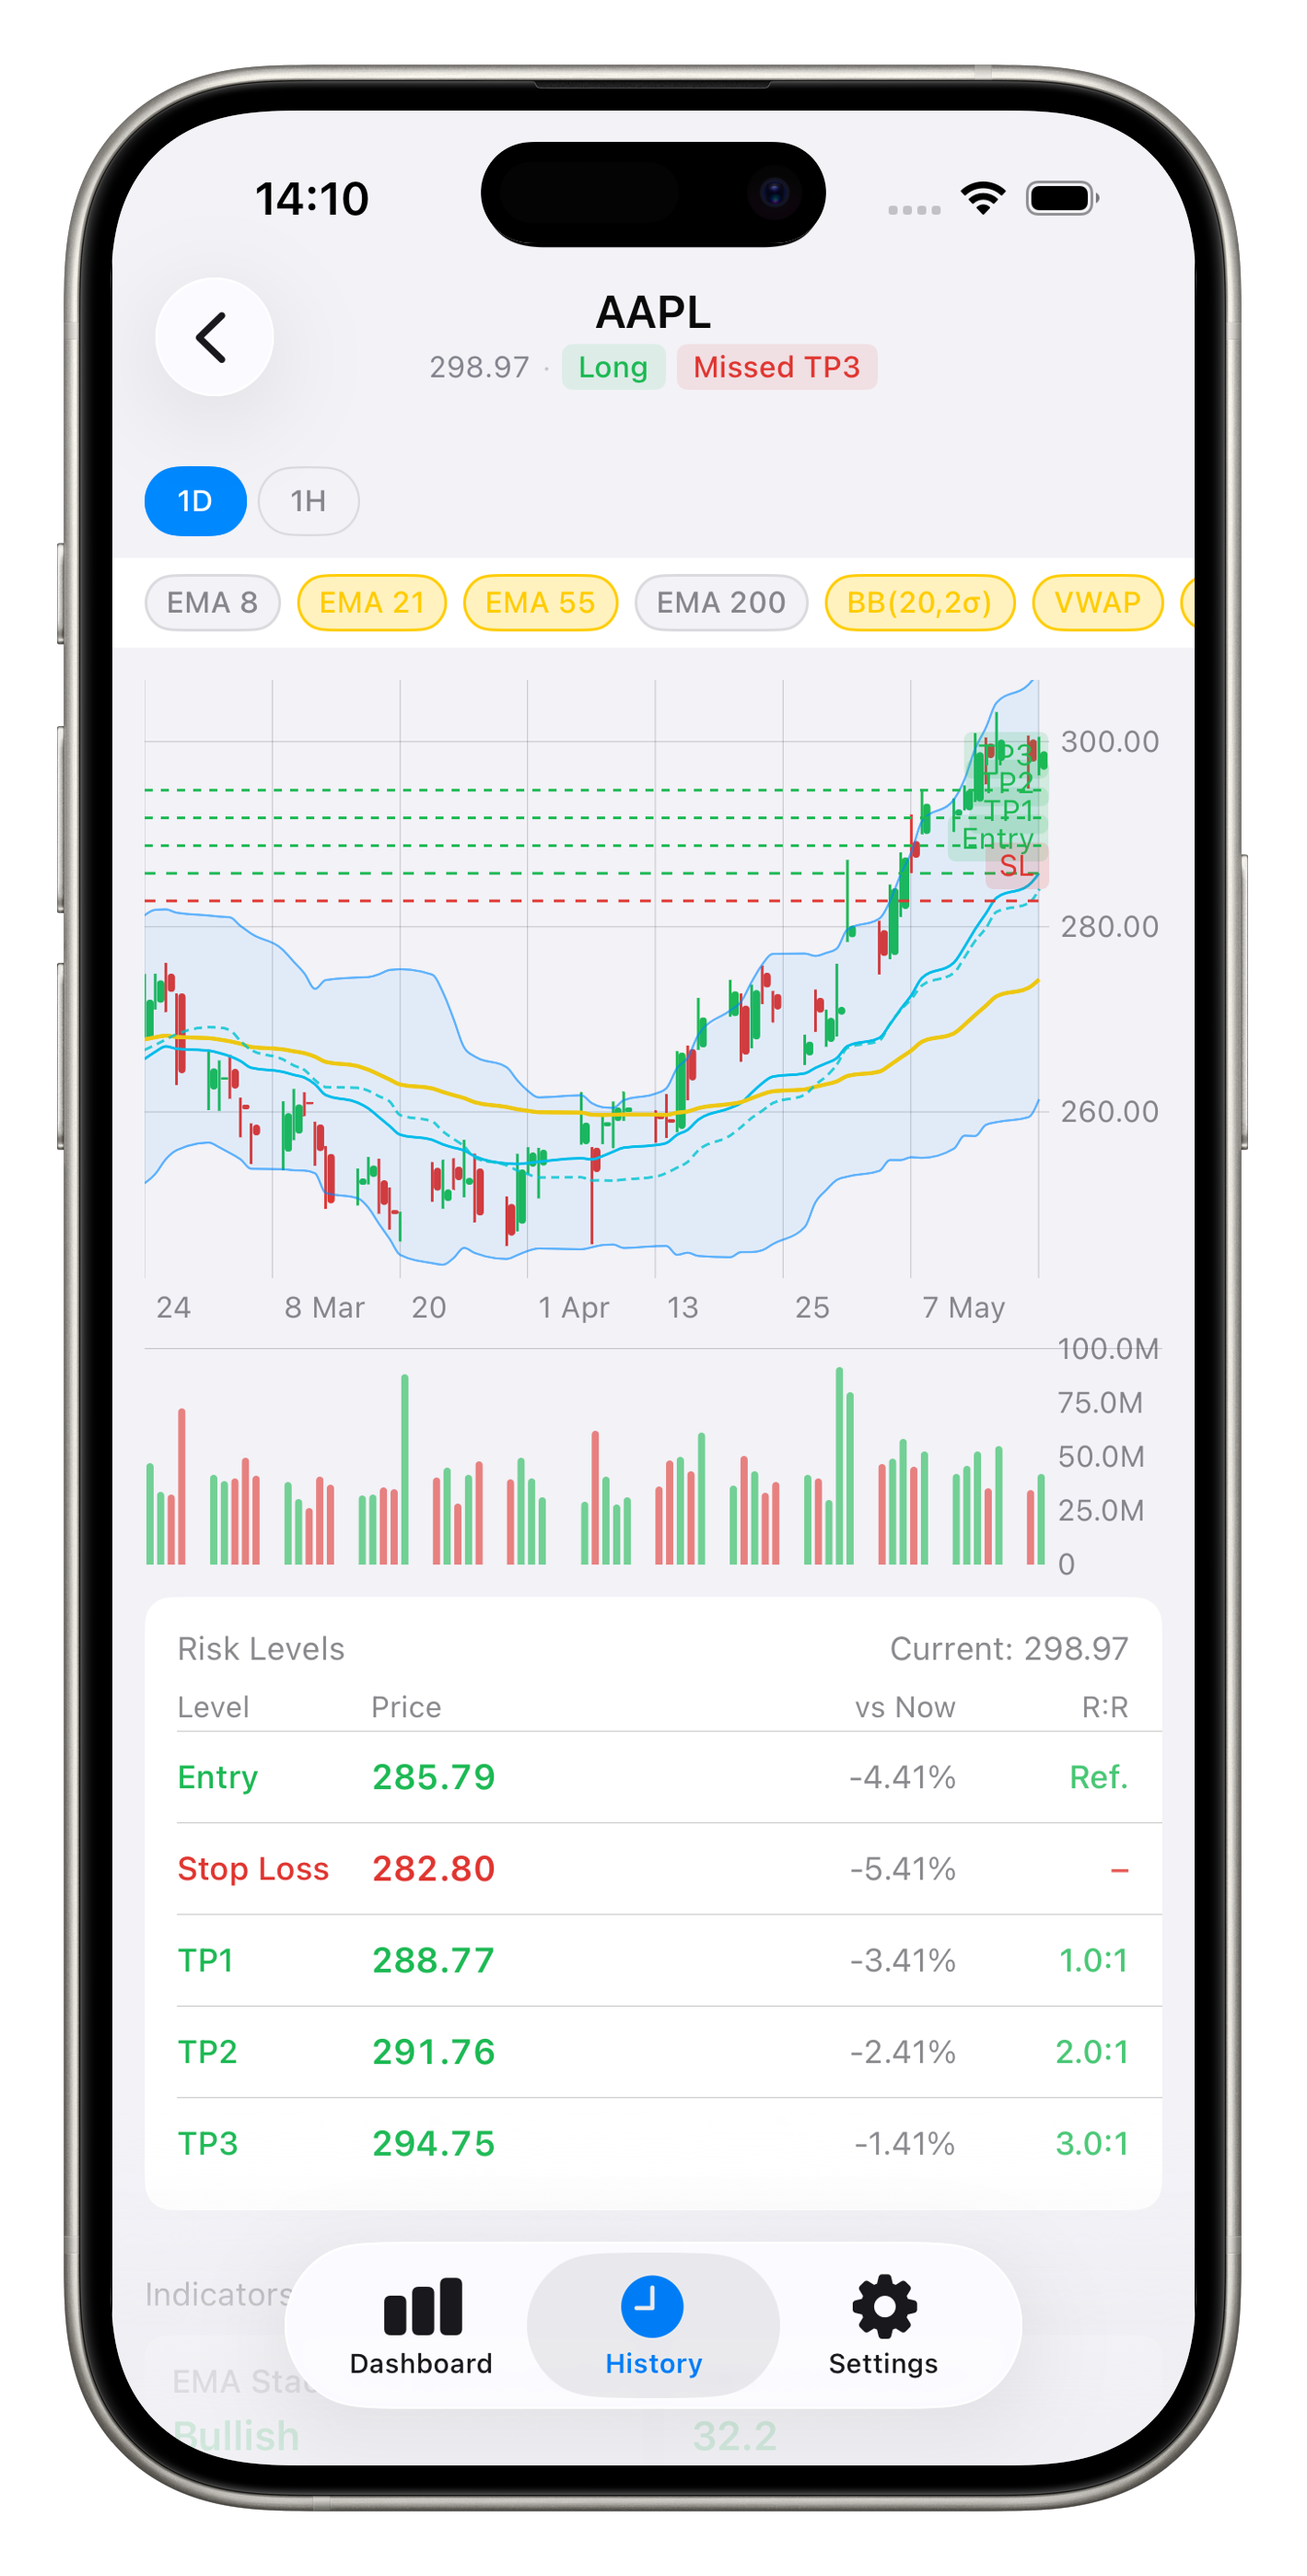
Tap any symbol on the dashboard or in History to open the full analysis view - an interactive candlestick chart with overlays, a risk levels matrix, and a complete indicator grid.
AAPL - Analysis View
Daily candlestick chart with EMA, Bollinger Bands & VWAP. Risk levels table below.
📆
Timeframes
Switch between 1D (daily) and 1H (hourly) bars with a single tap. Both timeframes use the same indicator parameters for consistency.
📐
Chart Overlays
Toggle EMA 8, EMA 21, EMA 55, EMA 200, Bollinger Bands (20, 2σ), and VWAP directly on the chart. Each overlay can be enabled or disabled individually.
📊
Volume Histogram
A colour-coded volume chart sits below the price chart. Green bars indicate up-volume, red bars indicate down-volume. Volume spikes are highlighted.
🎯
Risk Levels Matrix
A table below the chart shows the exact Entry, Stop Loss, TP1, TP2, and TP3 price levels alongside their distance from the current price and risk-to-reward ratio.
Risk Levels & R:R Ratios
Every snapshot calculates a complete risk matrix - so you know exactly where to enter, where to exit, and what the reward is for the risk taken.
Level
Calculation
Default R:R
Entry
EMA 21 adjusted by ATR proximity filter
Reference
Stop Loss
Entry - (1.5 × ATR)
-
TP1
Entry + (1.0 × ATR × TP1 multiplier)
1.0:1
TP2
Entry + (2.0 × ATR × TP2 multiplier)
2.0:1
TP3
Entry + (3.0 × ATR × TP3 multiplier)
3.0:1
ATR (Average True Range) is computed using a 14-period simple moving average of the true range - matching the Pine Script f_atr formula. The vs Now column shows the percentage distance from the current price so you can immediately see how far away each level is.
Technical Indicators
MagTicker computes a full suite of indicators on-device using the same mathematical logic as Pine Script v5/v6.
📉
EMA Stack (8/21/55/200)
Four exponential moving averages define the trend structure. When all four align (8 > 21 > 55 > 200), the EMA stack is fully bullish.
🌀
Bollinger Bands
20-period bands with 2σ width. A SQUEEZE state is detected when band width falls below 70% of a 50-period average - signalling a potential breakout.
⚡
RSI (14)
Wilder's 14-period RSI with overbought (70) and oversold (30) levels. RSI filters confirm or block signal direction. Intraday alerts fire at extreme crossings.
📏
ADX (14)
Average Directional Index with +DI / -DI. ADX ≥ 20 confirms a trend is present. ADX ≥ 30 indicates a strong trend. Weak ADX suppresses directional signals.
🔃
StochRSI (14/14/3/3)
Stochastic applied to RSI values. %K and %D lines with overbought (80) and oversold (20) levels. Used for both signal scoring and intraday alerts.
📌
MACD (12/26/9)
Classic MACD with fast EMA 12, slow EMA 26, and signal line EMA 9. Histogram shows momentum direction and is factored into the overall strategy score.
💹
VWAP & Fibonacci
20-period rolling VWAP proxy. Fibonacci retracement levels (38.2%, 50%, 61.8%) and extensions computed from the 20-bar swing high and low.
📈
ATR & Volume
14-period SMA-based ATR for stop and target calculation. Volume vs 20-period average ratio with spike detection (≥2×). Volume context fed into the scoring engine.
Automated Market Notifications
MagTicker schedules five analysis snapshots per trading day aligned to key market moments - all as local notifications, with no remote push server.
14:00 UK
Pre-Market
Morning analysis before the US market opens. Sets the directional bias for the day using overnight data.
14:35 UK
Market Open
First 30-minute confirmation snapshot. Captures the opening move and updates entry levels for the session.
17:30 UK
Mid-Session
Midday check-in as US mid-morning momentum develops. Re-evaluates status for all 7 symbols.
21:05 UK
Market Close
End-of-day snapshot with final prices, updated stop levels, and a daily score for each symbol.
Fri 21:30 UK
Weekly
Friday close summary across all 7 stocks. Weekly candle data used for higher-timeframe bias confirmation.
In addition to scheduled snapshots, intraday alerts fire when RSI crosses overbought/oversold levels, StochRSI extremes are reached, or Bollinger Bands enter a SQUEEZE state. Each condition has a per-session cooldown to prevent notification flooding. The latest alerts also appear on the Dashboard in the Recent Alerts card.
History & Snapshots
Every analysis snapshot is saved locally so you can review past strategy states, track how signals evolved, and compare setups across time.
📑
Full Snapshot Record
Each saved entry includes the full strategy output: bias, entry, stop loss, TP1-TP3, score, star rating, close price, RSI, ADX, and all indicator values at that moment.
🔍
Filter & Sort
Filter history by symbol, anchor type (Pre-Market, Open, Close…), or signal direction. Sort by newest first, or by any column to find the highest-rated setups.
📌
Pin Important Snapshots
Swipe to pin any snapshot and it will never be purged by the automatic 30-day retention policy. Pinned entries are kept indefinitely.
⏱️
30-Day Retention
Unpinned snapshots older than 30 days are automatically removed to keep on-device storage lean. Pinned records are always preserved.
Portfolio Tracker
Record your MAG-7 holdings and MagTicker calculates your live P&L using the latest fetched prices.
💰
Add Holdings
Enter symbol, quantity, and average cost basis for any MAG-7 position. Supports fractional shares up to 6 decimal places.
💵
Live P&L
Today's P&L and total P&L are calculated by merging your cost basis with the latest live quote. Updates automatically while the app is in the foreground.
🔐
Stays On Device
Cost basis and quantities are stored locally in SwiftData with iCloud sync disabled. Your financial data never leaves your iPhone.
Market Data Sources
MagTicker fetches price data directly from publicly accessible providers - no intermediary server is involved.
✓ Yahoo Finance (free, no key)
✓ Finnhub (optional API key)
✓ Tiingo (optional API key)
Yahoo Finance is the default and fallback provider - no account or API key required. Finnhub and Tiingo are optional sources with higher rate limits, configurable in Settings → Data Provider. API keys are stored in the iOS Keychain with kSecAttrAccessibleAfterFirstUnlockThisDeviceOnly and protected behind Face ID before they can be viewed.
Security & Privacy
MagTicker is built with Apple's native frameworks only. No third-party analytics, advertising, or crash reporting SDKs are integrated.
🔑
Keychain + Face ID
API keys are stored in the iOS Keychain and revealed only after Face ID or Touch ID authentication. Keys are device-bound and excluded from all backups.
🔐
Certificate Pinning
Connections to Finnhub and Tiingo use SPKI SHA-256 public-key pinning via CryptoKit. Man-in-the-middle attacks in Release builds are blocked at the TLS layer.
🚫
Zero Data Collection
No analytics, no telemetry, no tracking. Your watchlist, portfolio, and usage patterns are never sent anywhere. The developer has no backend server to receive them.
📱
On-Device Processing
Every indicator, signal, score, and risk level is computed on your iPhone. No cloud compute, no API calls for analysis - only for fetching raw price data.
Requirements
What you need to run MagTicker.
Requirement
Detail
Platform
iPhone
iOS Version
iOS 18.0 or later
Price
Free (optional Tip Jar)
Internet
Required to fetch live prices and historical candle data
API Keys
Optional - Yahoo Finance works without any key; Finnhub and Tiingo require free or paid accounts
Notifications
Optional - required for scheduled market snapshots and intraday alerts
Age Rating
4+ (no objectionable content)
Contact & Support
If you have questions, feedback, or feature requests for MagTicker, you can reach the developer on X: